Interactive videos are designed to do more than hold attention. They are built to drive action.
Whether viewers are clicking a CTA, submitting a form, exploring a hotspot, discovering products, or participating in a poll, every interaction tells a story.
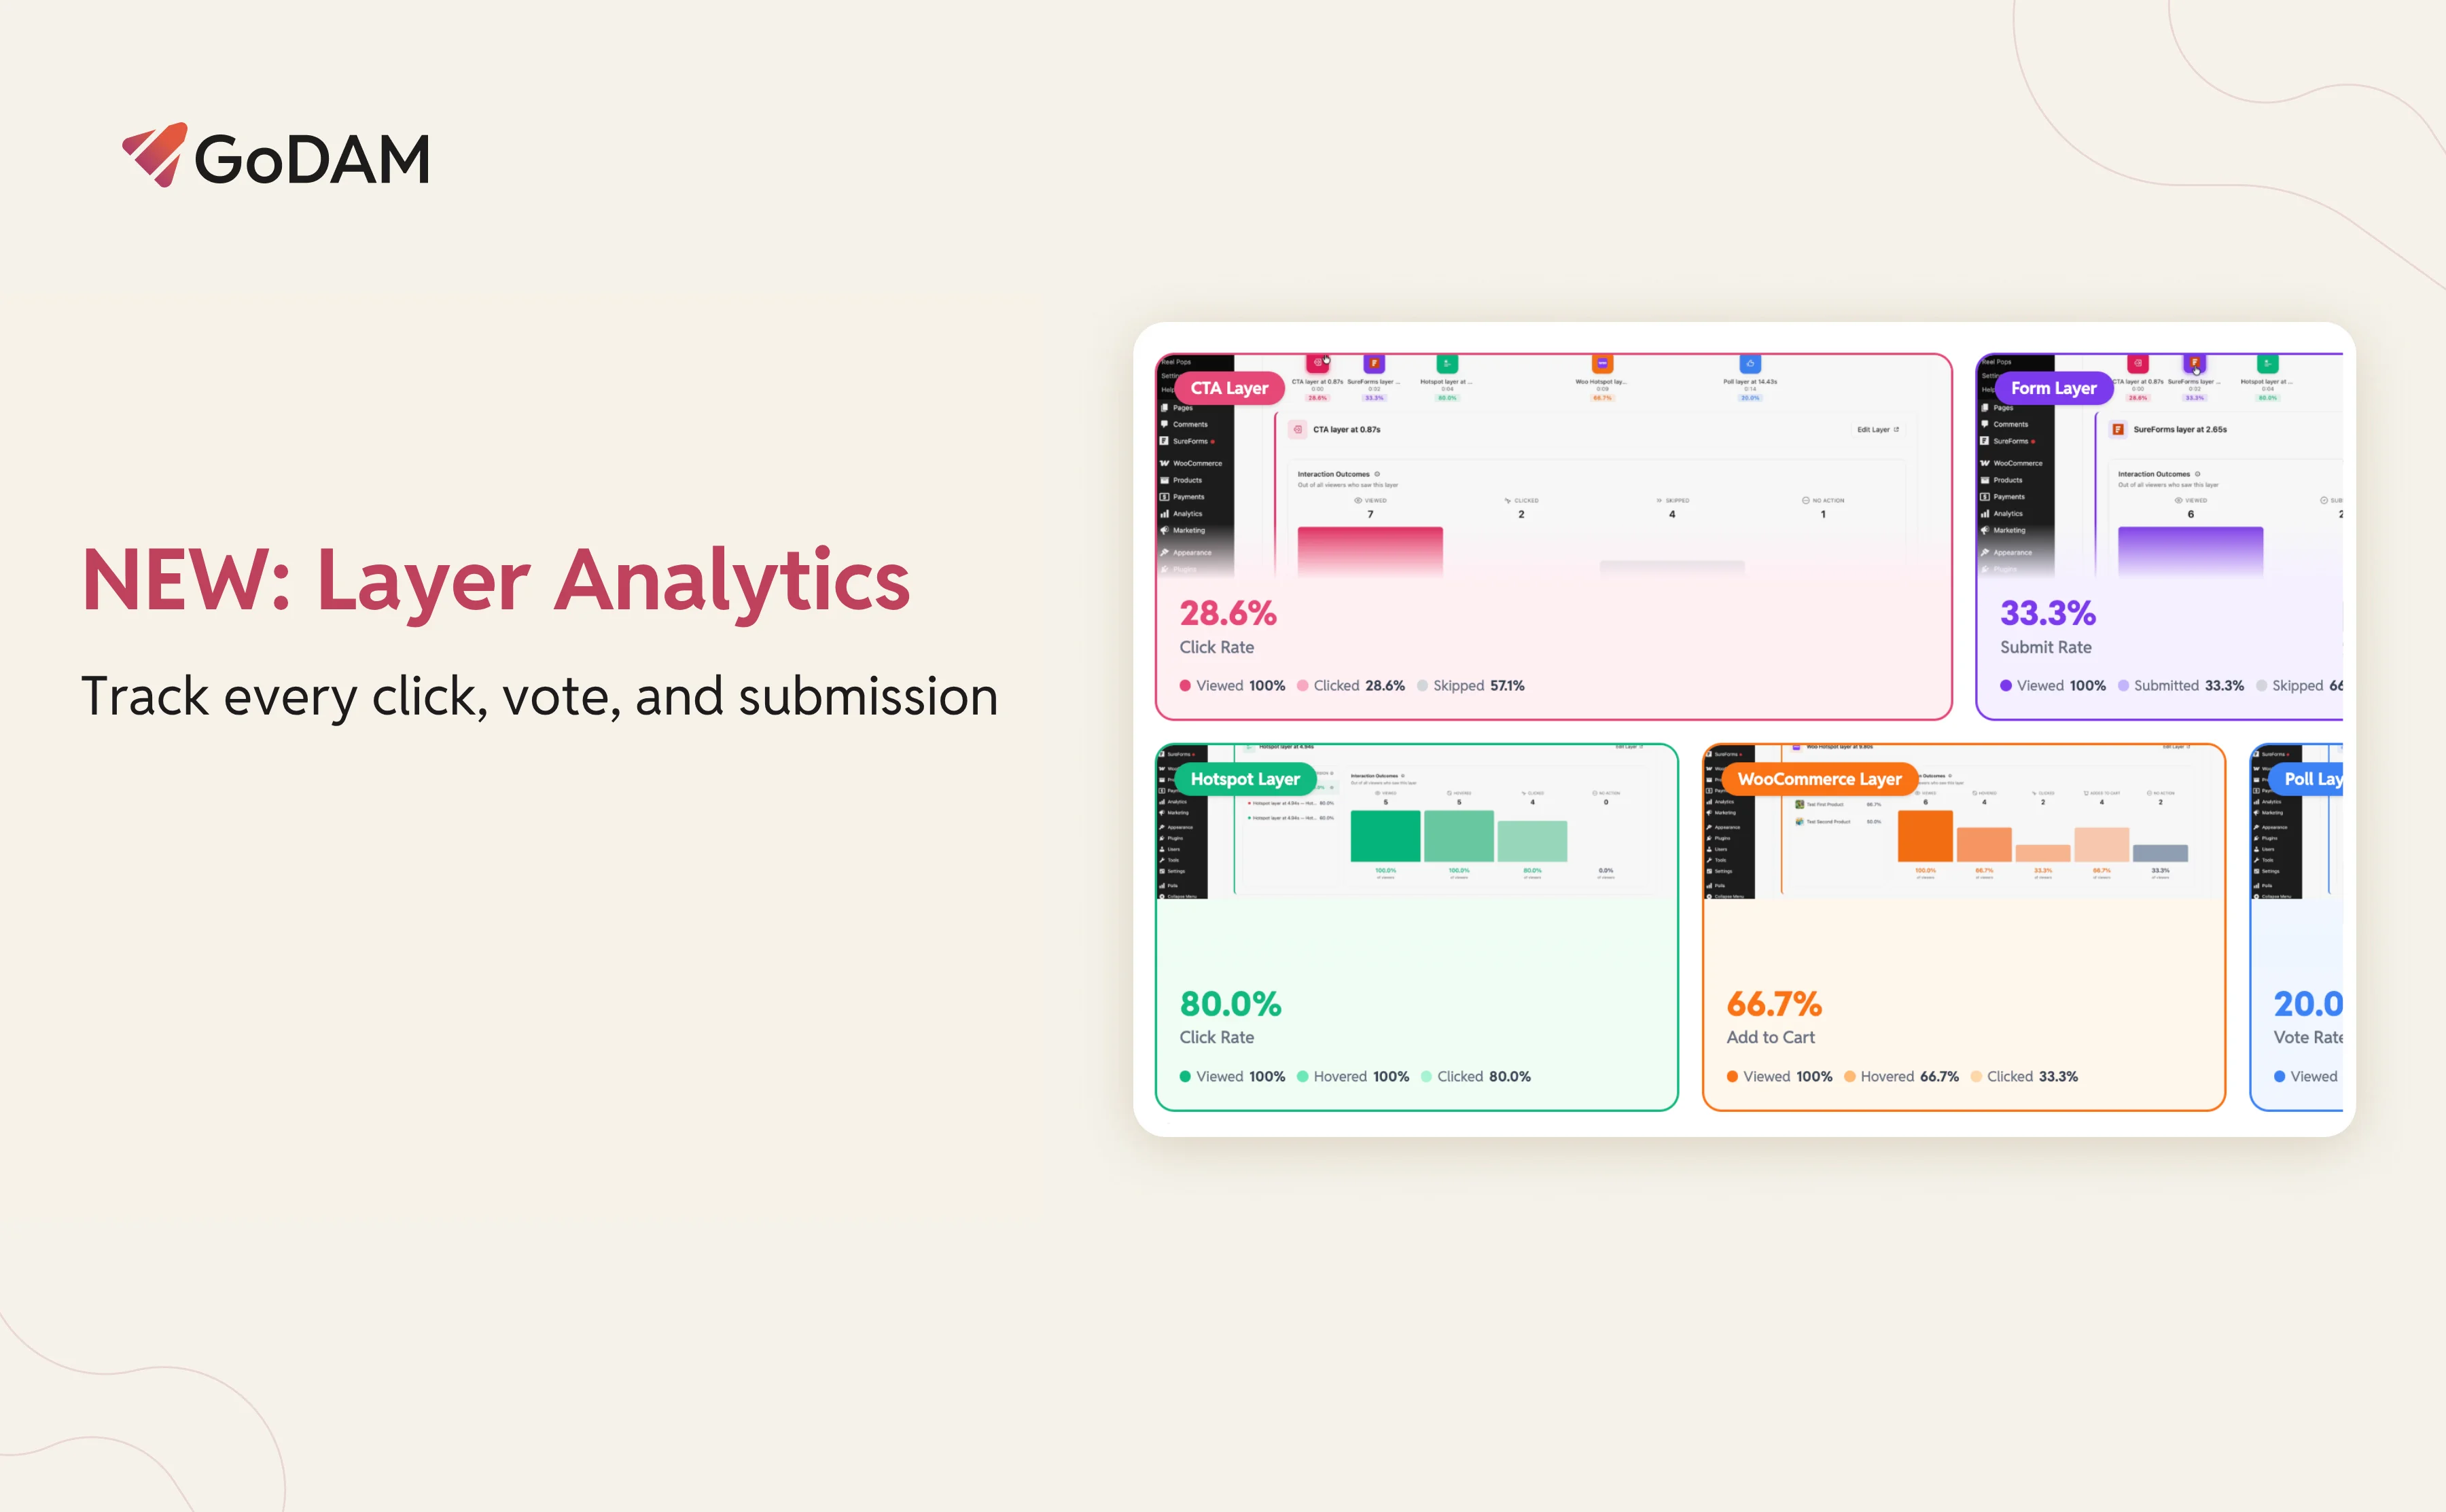
Today, we’re introducing Layer Analytics, a new analytics experience that reveals how viewers interact with every layer inside your videos.
With Layer Analytics, you can answer questions like:
- Which CTA gets the most clicks?
- Are viewers submitting my forms?
- Which hotspot attracts the most attention?
- Which product hotspot drives the most add-to-cart actions?
- Are people engaging with my polls or skipping them?
See how every layer performs, understand what drives engagement, and uncover the interactions that lead to results.
Why layer analytics matters
Most video analytics tools focus on views, watch time, and engagement rates.
Those metrics tell you how people consume your content. They don’t tell you what actions viewers take.
A video can have excellent retention and still fail to generate clicks, leads, product interest, or feedback.
For teams using interactive video, those actions are often the metrics that matter most.
Layer Analytics brings conversion-focused reporting directly into GoDAM, helping you understand how every interactive layer contributes to performance.
You can see how each layer performs, where it appears in the video, and how viewers interact with it.
Meet the new video layer timeline
To make layer performance easier to analyze, we’ve introduced a new section inside single video analytics: Video Layer Timeline.
Each interactive layer appears as a marker positioned at the exact moment it appears during playback.
At a glance, you can see:
- Where layers appear
- What type of layer they are
- Their conversion performance
- How viewers interacted with them
Click any marker to view detailed performance data.
Depending on the layer type, you’ll see interaction funnels showing how viewers progress through each step.
Supported layer types include:
CTA analytics
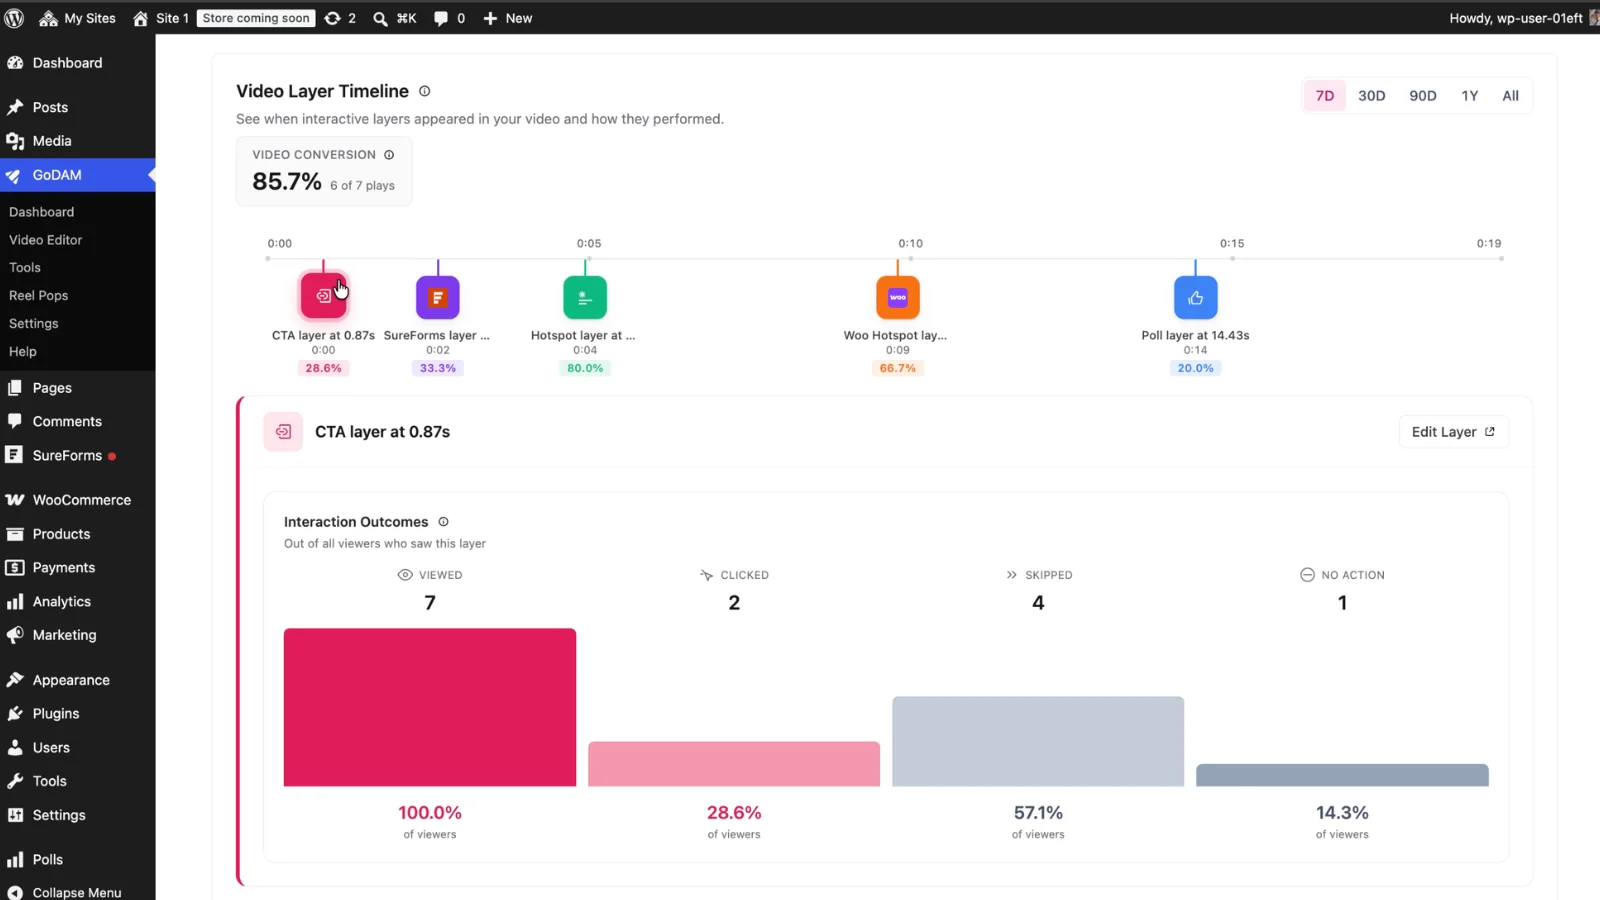
For CTA layers, Layer Analytics tracks:
- Viewed
- Clicked
- Skipped
A CTA that receives plenty of views but few clicks may need better timing, stronger copy, or a more compelling offer.
Form analytics
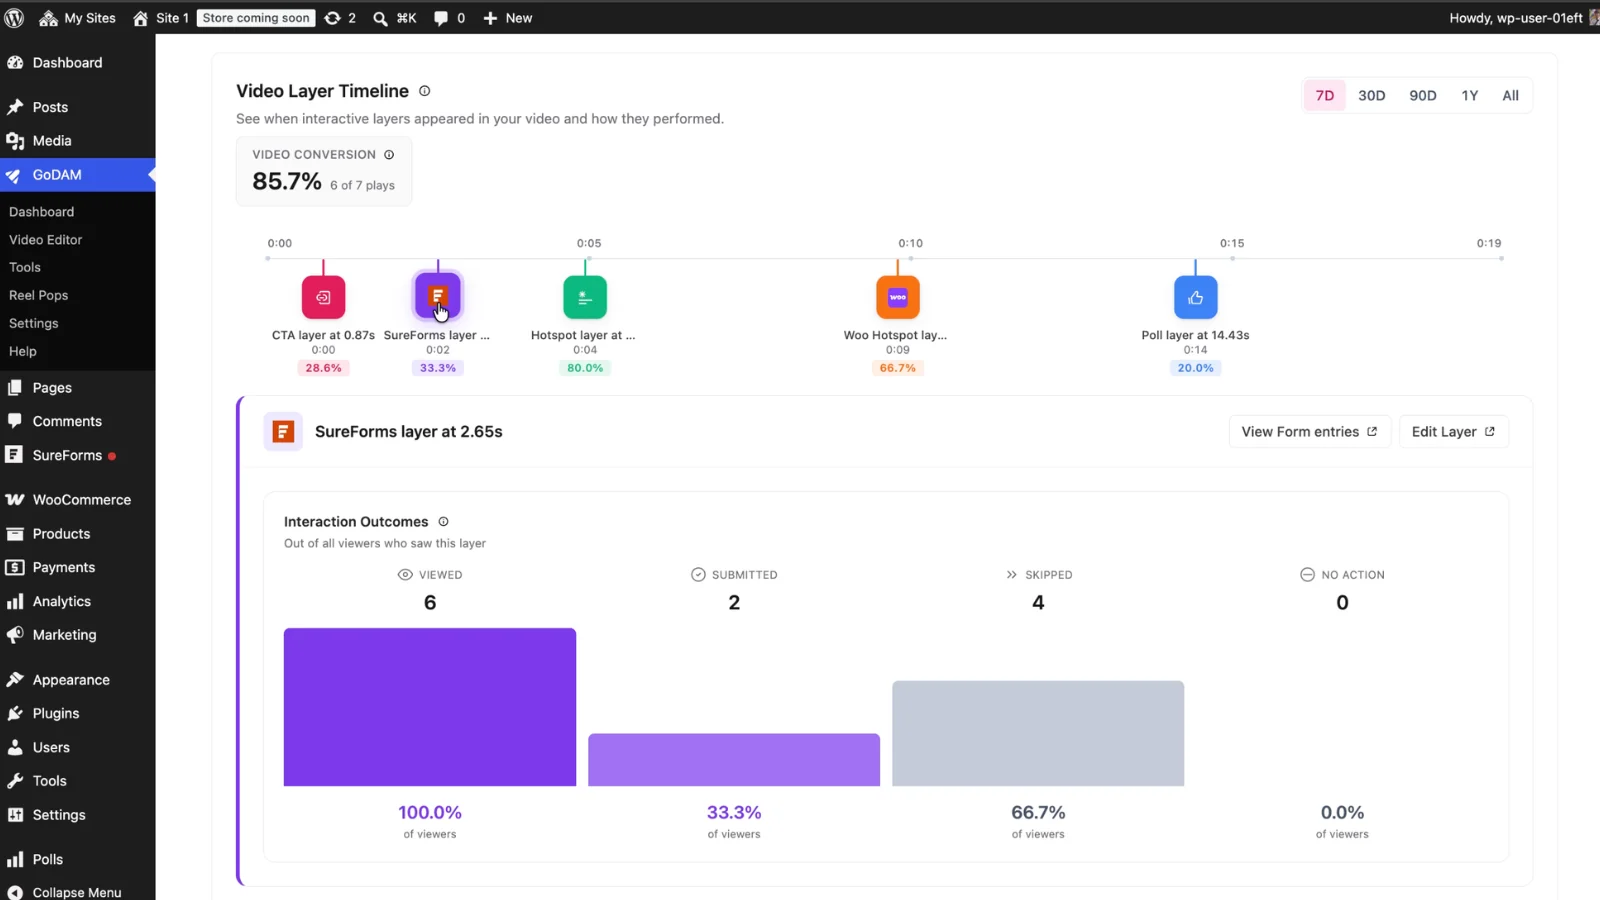
For form layers, Layer Analytics tracks:
- Viewed
- Submitted
- Skipped
You can see how many viewers reach a form and how many complete it, making it easier to identify drop-off points and improve conversions.
Hotspot analytics
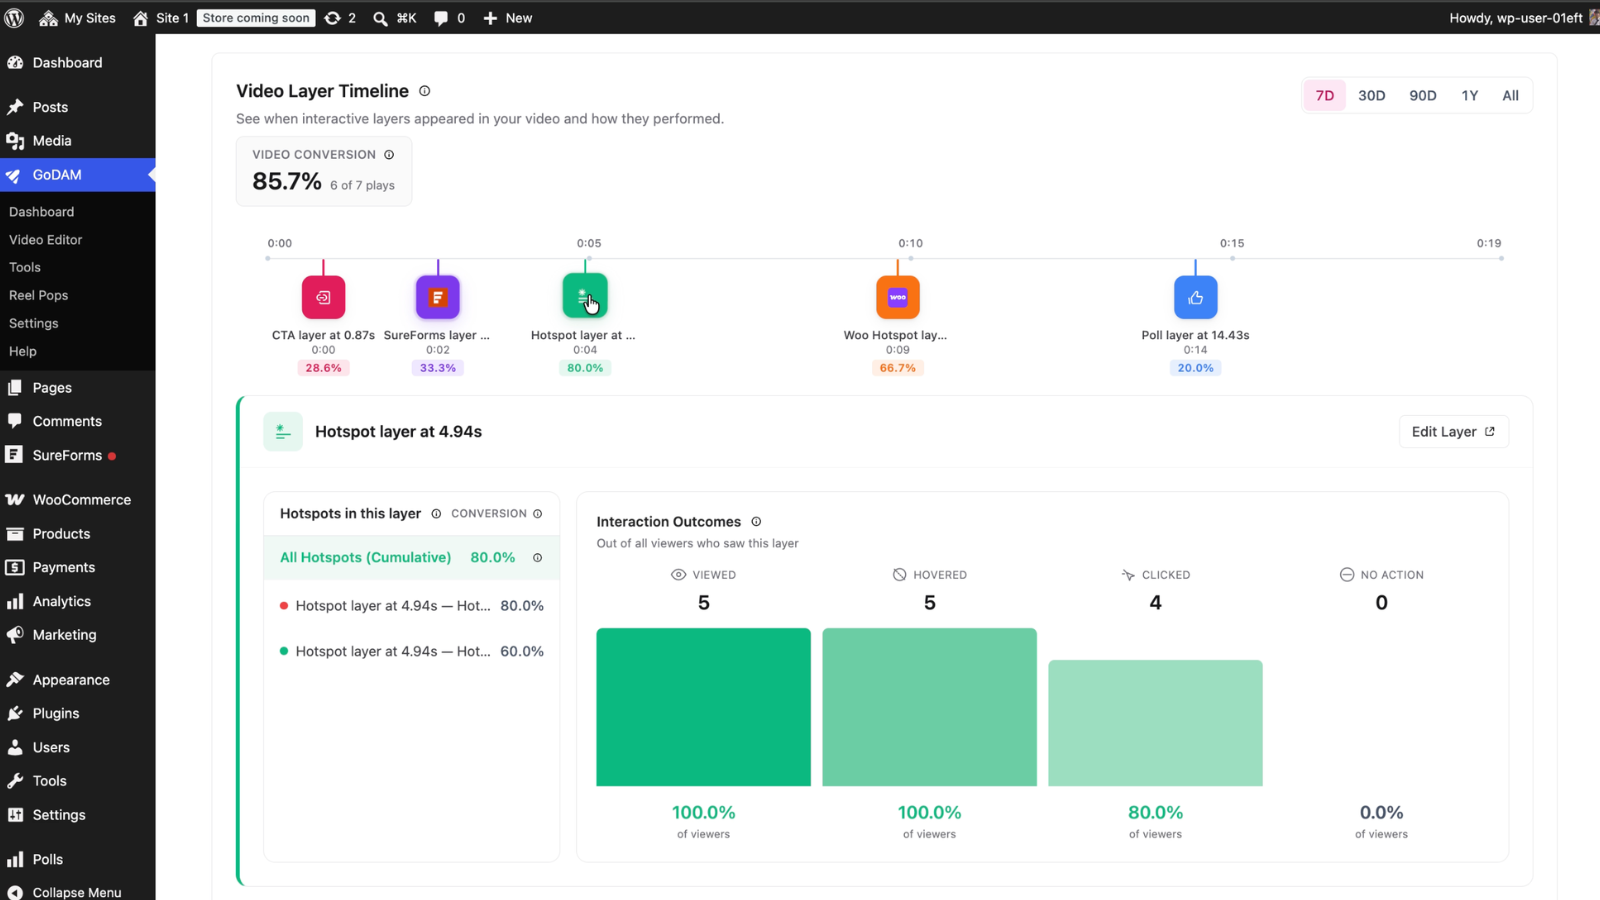
For standard hotspots, Layer Analytics tracks:
- Viewed
- Hovered
- Clicked
Hover data provides additional context by showing which hotspots attract attention, even when viewers don’t click.
WooCommerce hotspot analytics
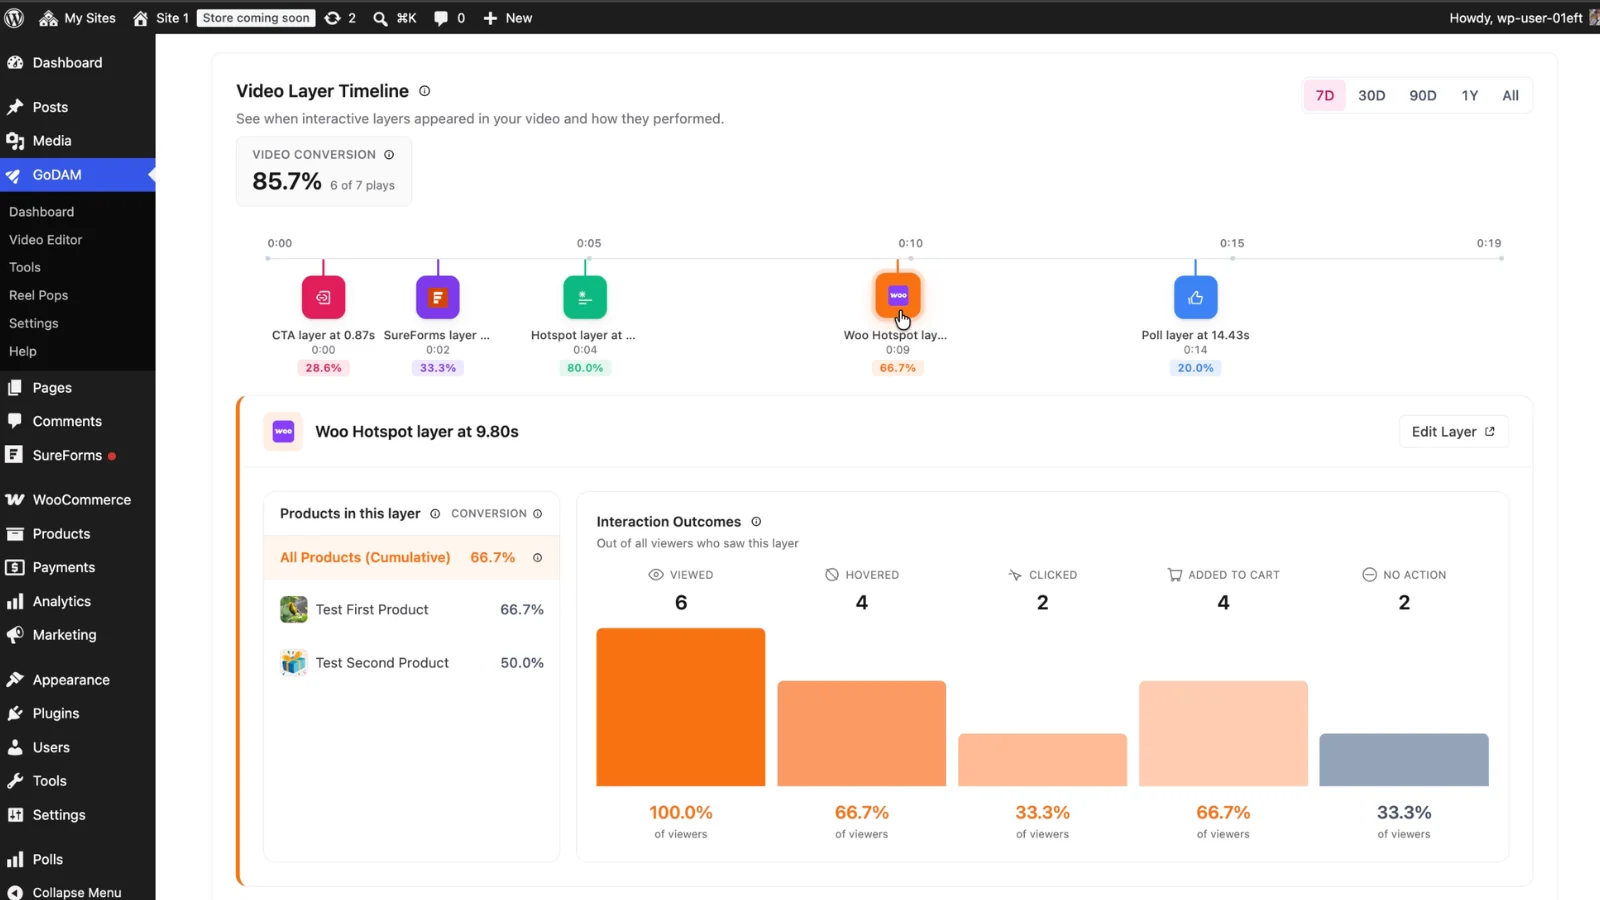
WooCommerce hotspots track:
- Viewed
- Hovered
- Clicked
- Added to cart
This makes it possible to measure product engagement directly inside the video player.
For example, a product hotspot with strong engagement and a high add-to-cart rate is a clear signal that placement is working. If a product receives views but little interaction, it may be worth repositioning or replacing.
You can also compare individual products within the same hotspot layer.
Inside the Video Layer Timeline, you’ll find a dedicated product breakdown that helps you identify:
- Top-performing products
- Underperforming products
- Products generating add-to-cart activity
- Products attracting attention but not driving action
For ecommerce businesses, this creates a direct connection between video engagement and product discovery.
Poll analytics
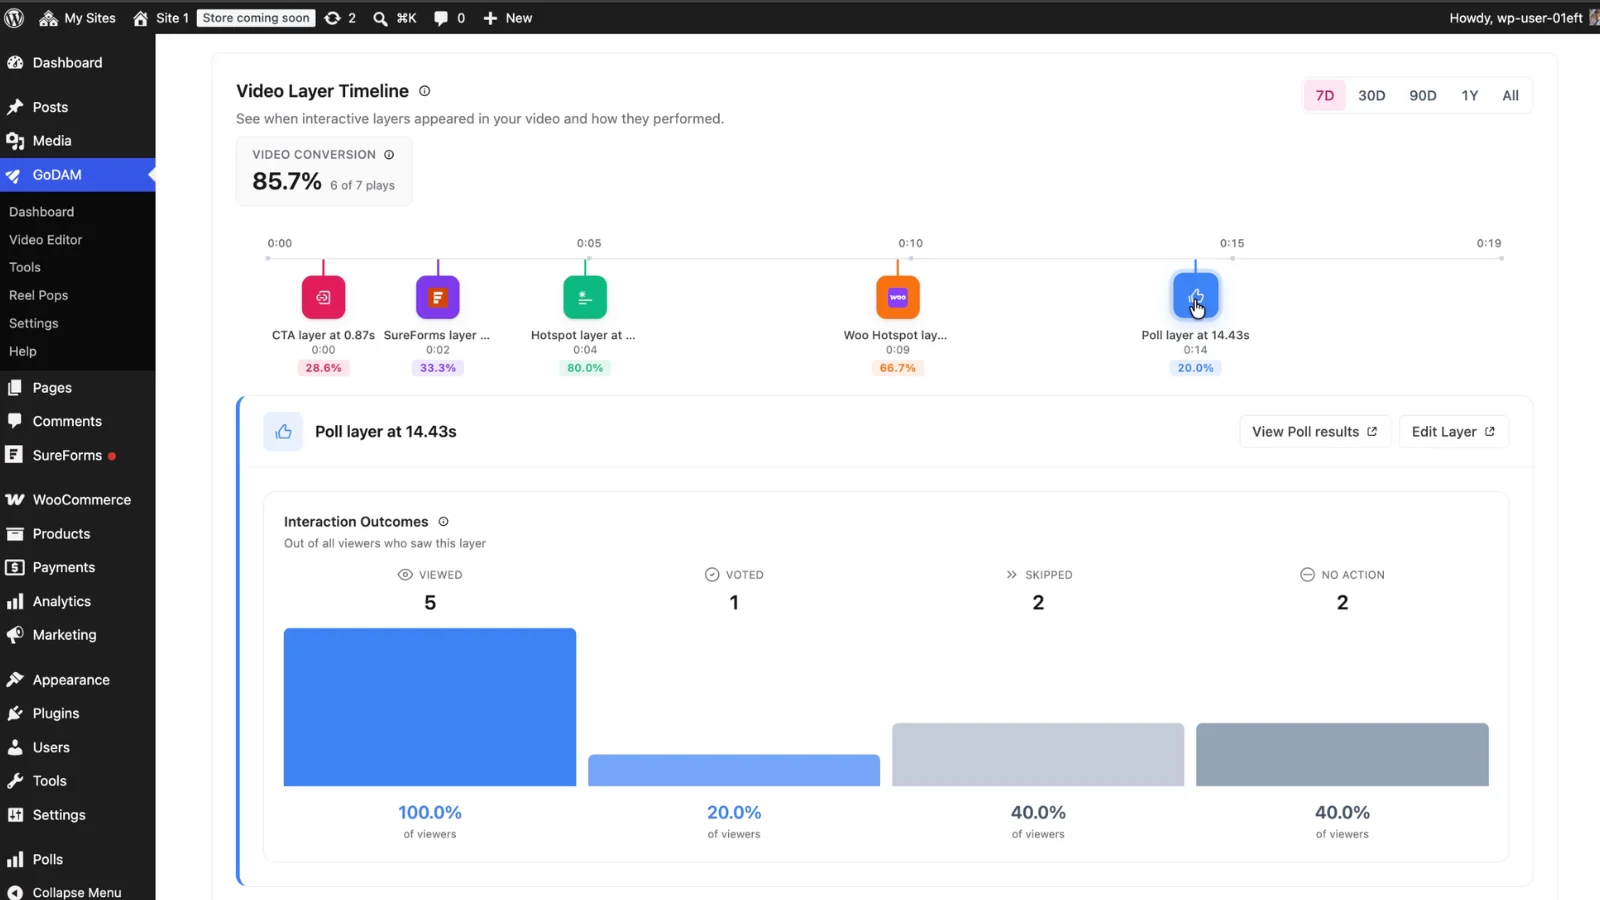
For poll layers, Layer Analytics tracks:
- Viewed
- Voted
- Skipped
This helps you understand whether viewers are participating or moving on.
Understand conversion at a glance
Layer Analytics focuses on conversion measurement.
Each layer type includes a clear conversion calculation:
- CTA conversion = Clicked ÷ Viewed
- Form conversion = Submitted ÷ Viewed
- Hotspot conversion = Clicked ÷ Viewed
- WooCommerce conversion = Clicked ÷ Viewed
- Poll conversion = Voted ÷ Viewed
Because repeated actions from the same viewer session are deduplicated, your metrics reflect actual user behavior rather than accidental repeat interactions.
Built for marketers, creators, agencies, and store owners
Marketers
Marketing teams can quickly identify which CTAs and forms generate the highest conversion rates, making campaign optimization faster and more data-driven.
Content creators
Creators can see which moments generate interaction and use those insights to improve future content.
Agencies
Agencies gain a clearer way to demonstrate results to clients by reporting on actions and conversions, not just views and watch time.
Ecommerce stores
WooCommerce users can measure product engagement directly inside video content and identify opportunities to improve merchandising and conversions.
How to start using layer analytics
Getting started is simple.
If you’re already using interactive layers, Layer Analytics begins collecting data automatically.
To explore your layer performance:
- Open the GoDAM Analytics area.
- Navigate to a video’s analytics page.
- Scroll to the Video Layer Timeline section.
- Select any layer marker to view detailed metrics.
- Use date range filters to compare performance over time.
For form and poll layers, you can also jump directly to submission and results pages from the analytics interface.
Start optimizing every layer
Layer Analytics is now available in the latest GoDAM release.
Open your analytics, identify your highest-performing layers, and uncover opportunities to improve conversions across every interactive experience.
Ready to see which interactive layers drive results? Update to the latest version of GoDAM and explore the Video Layer Timeline today.
Leave a Reply