Steps to access Analytics screen
There are 2 ways to reach the Analytics screen:
First,
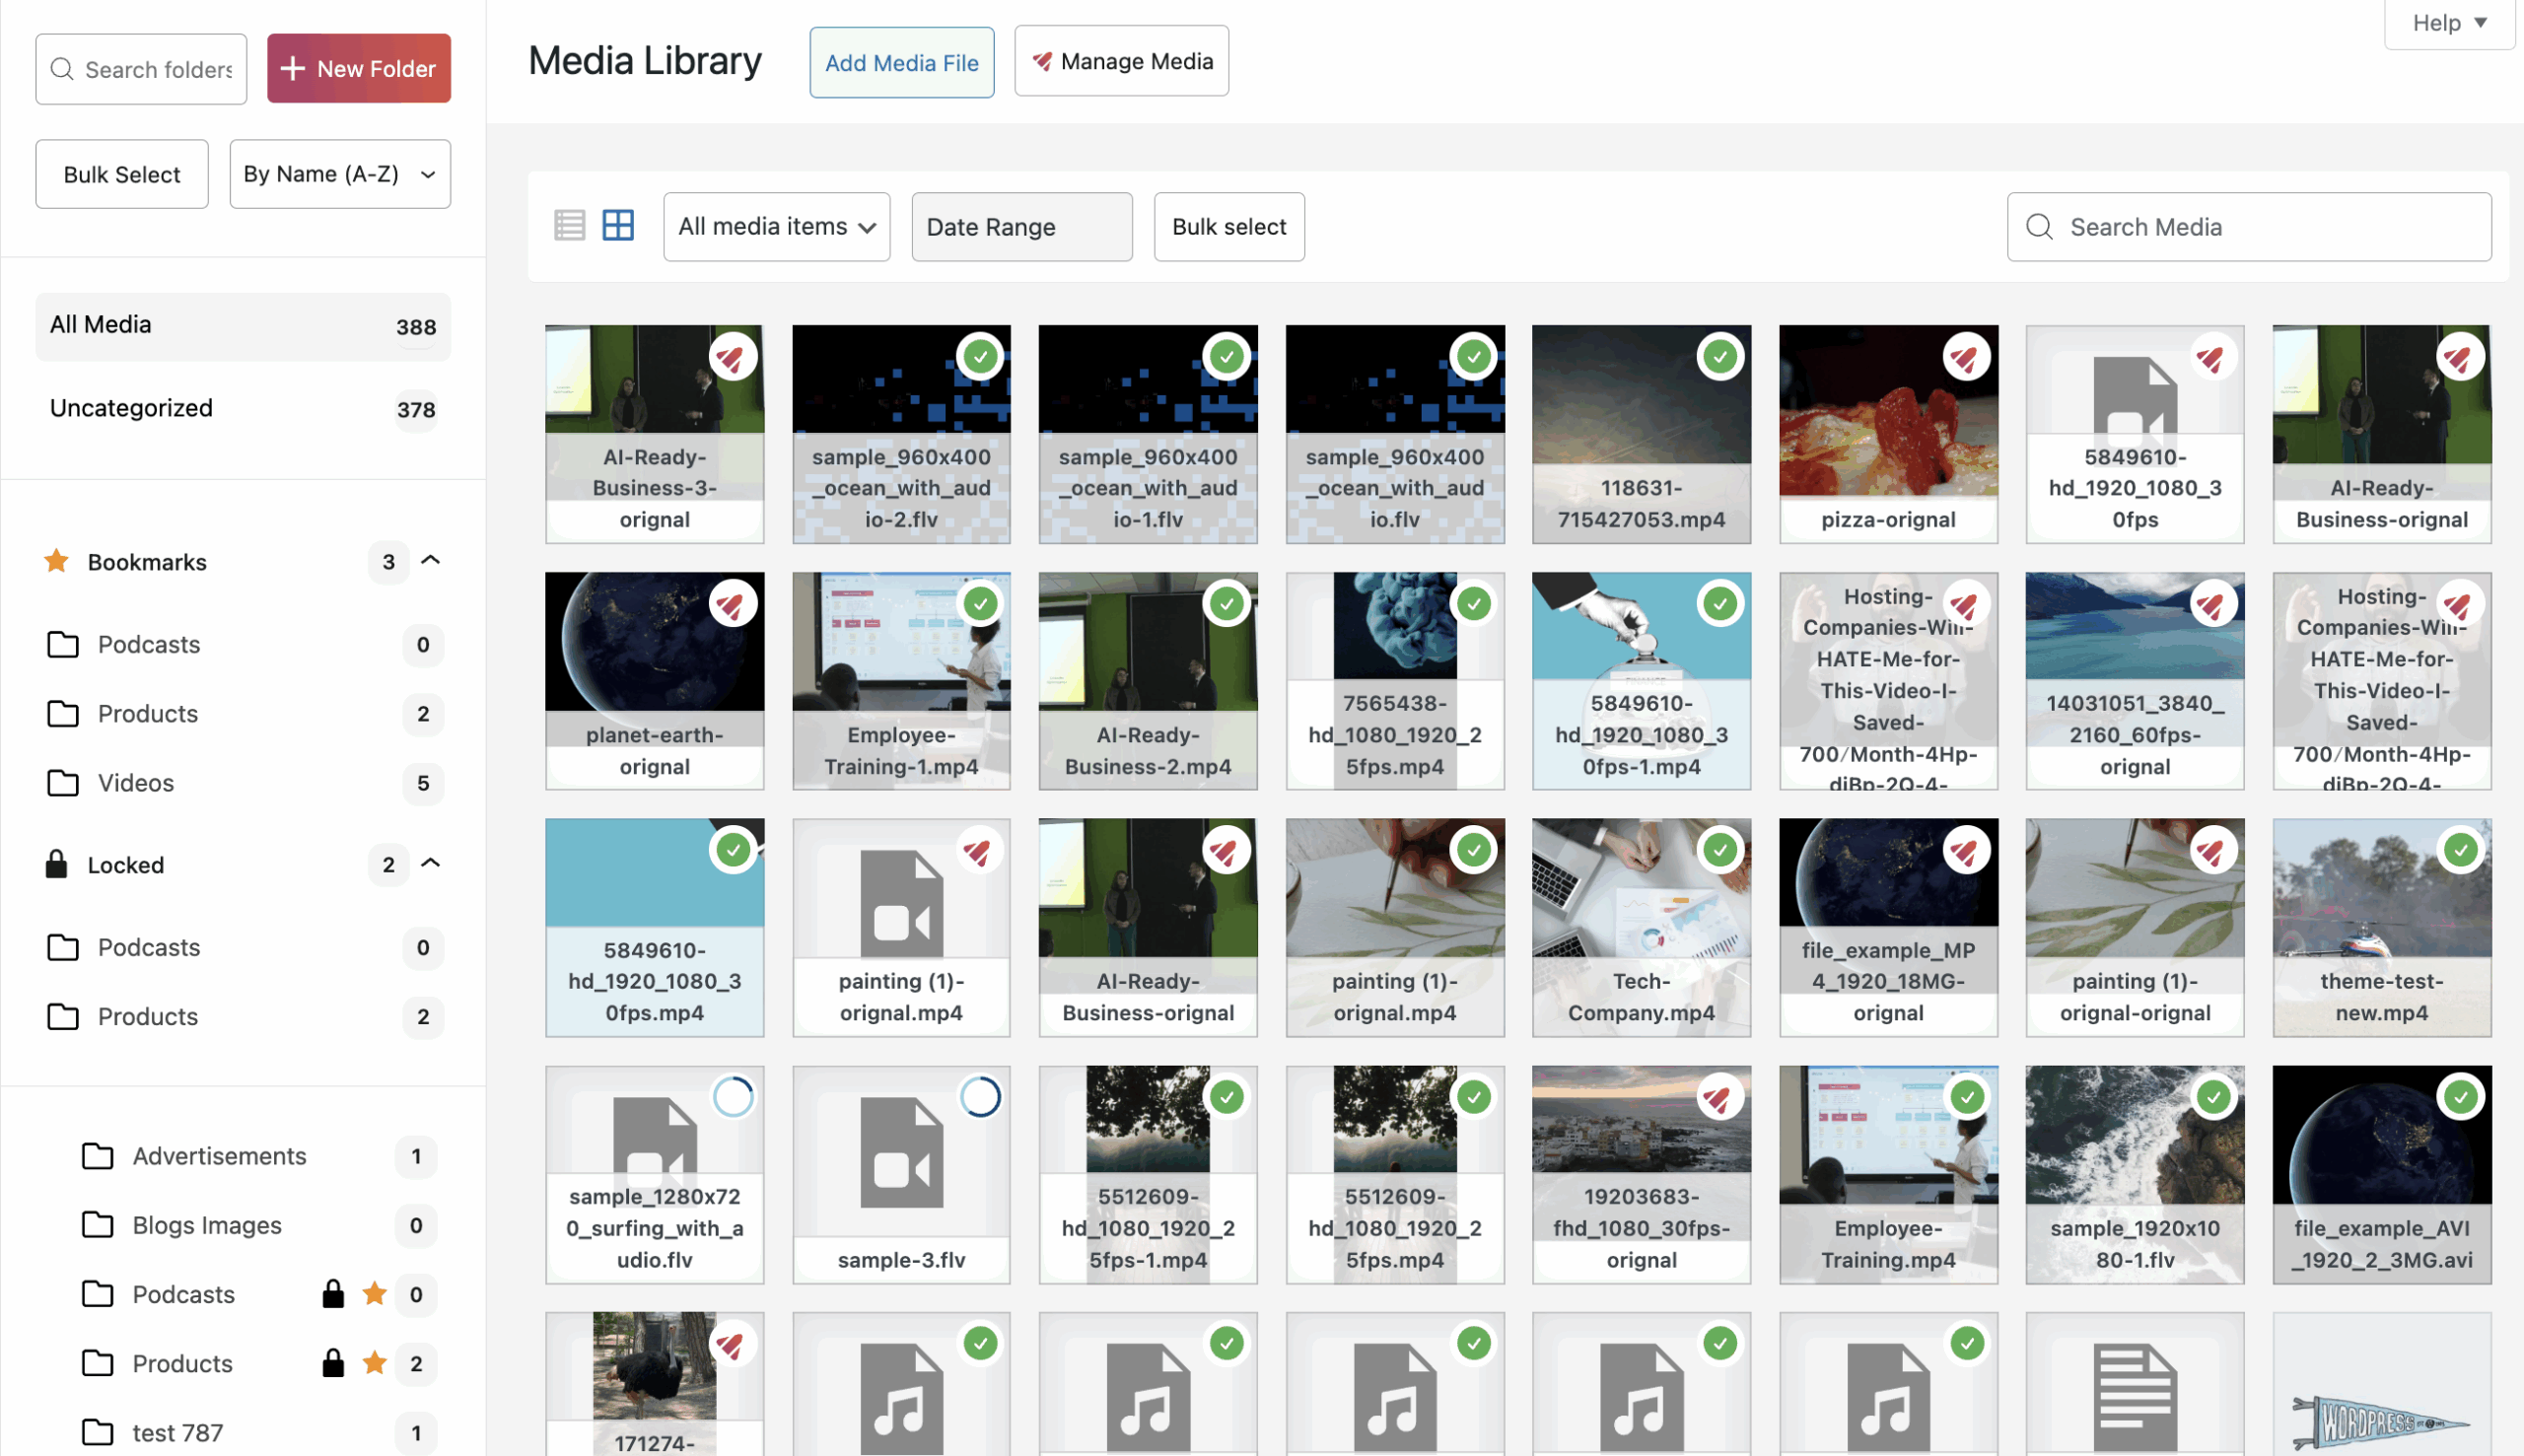
Step 1: Navigate to Media → Library
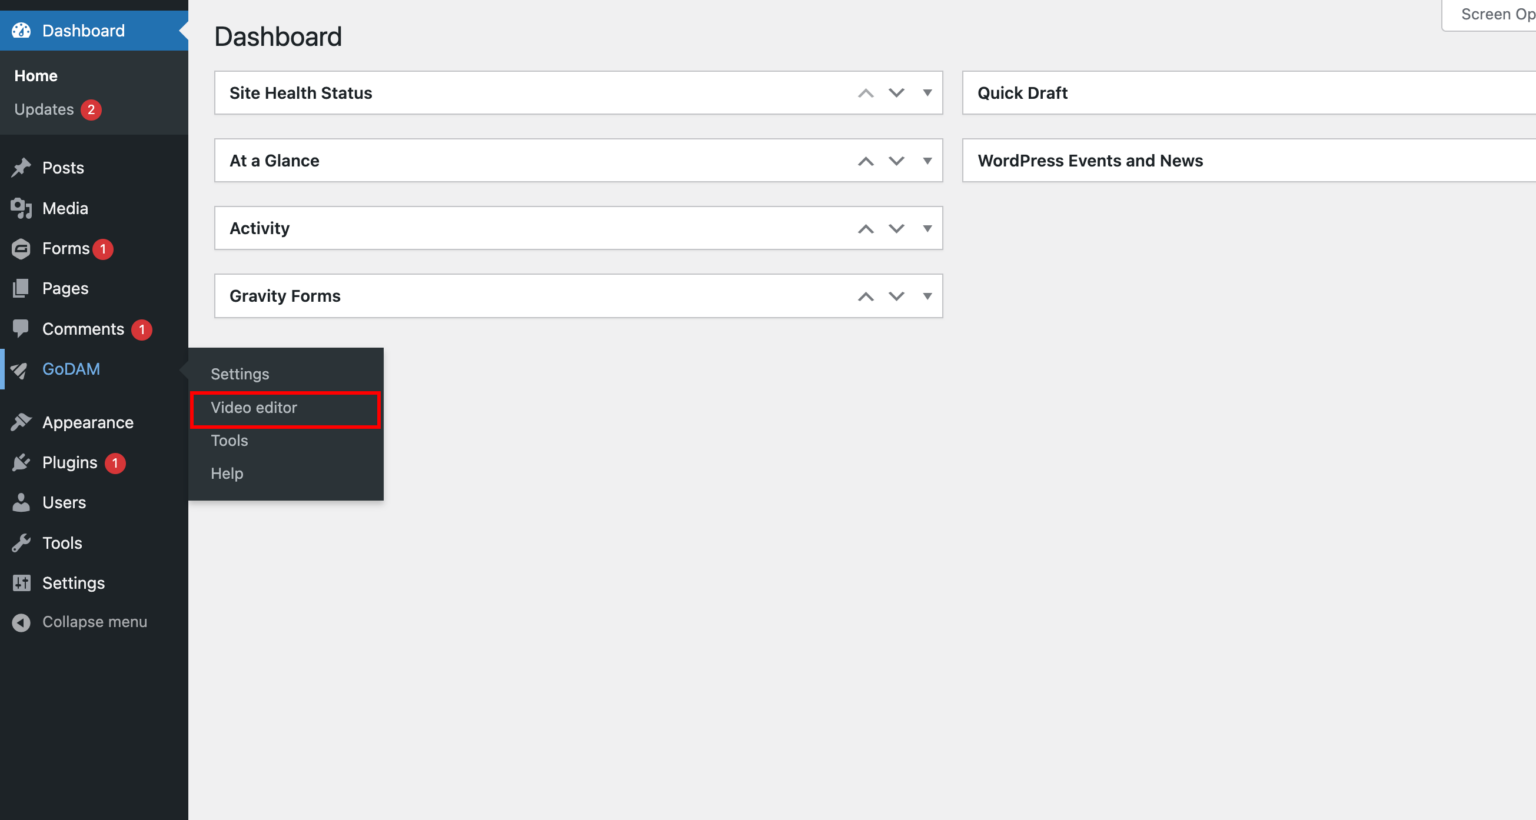
Step 2: Select a Video
- Browse through your uploaded videos.
- Click on the video for which you want to view analytics.
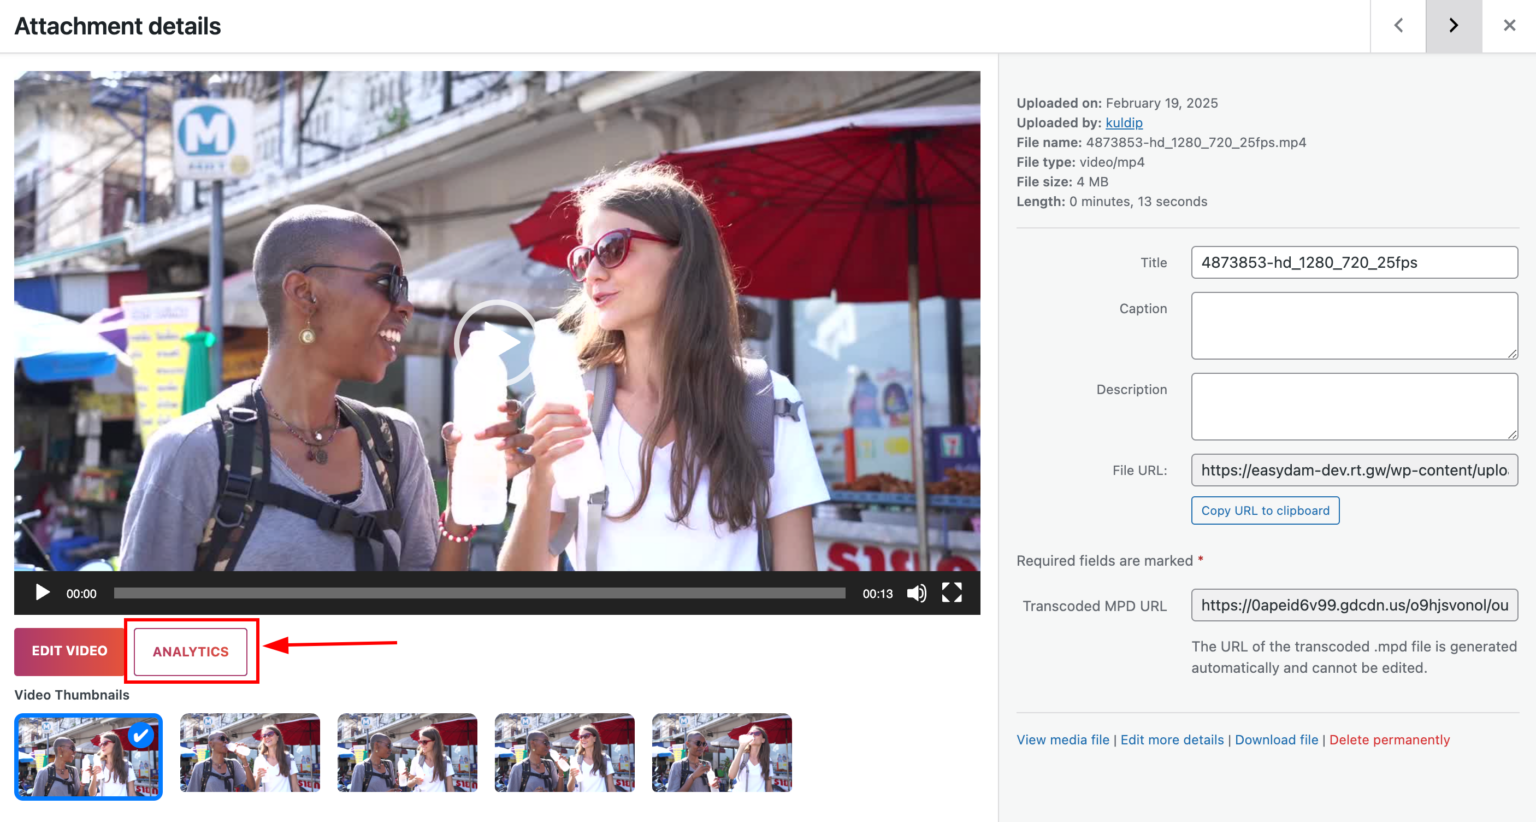
Step 3: Locate the Analytics button in the bottom-left corner
Second,
Step 1: Navigate to GoDAM → Video Editor
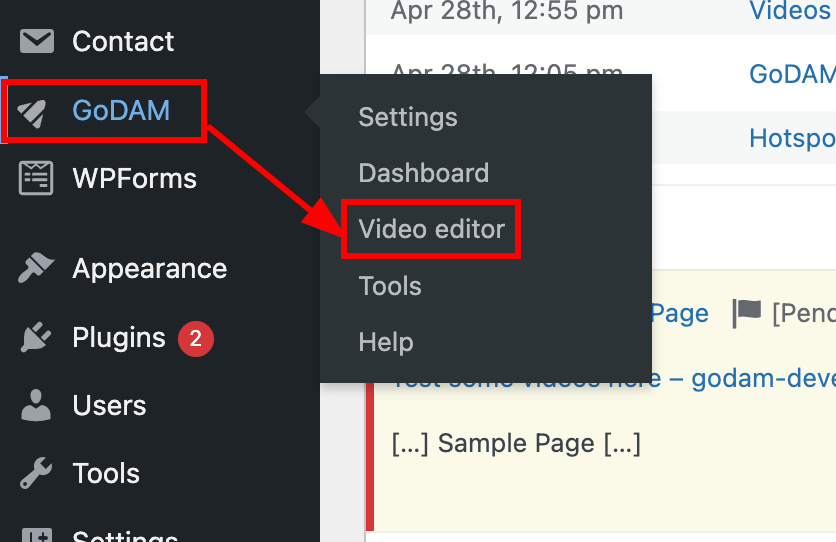
Step 2: Find the video for which you want to view the Analytics, click on three dots
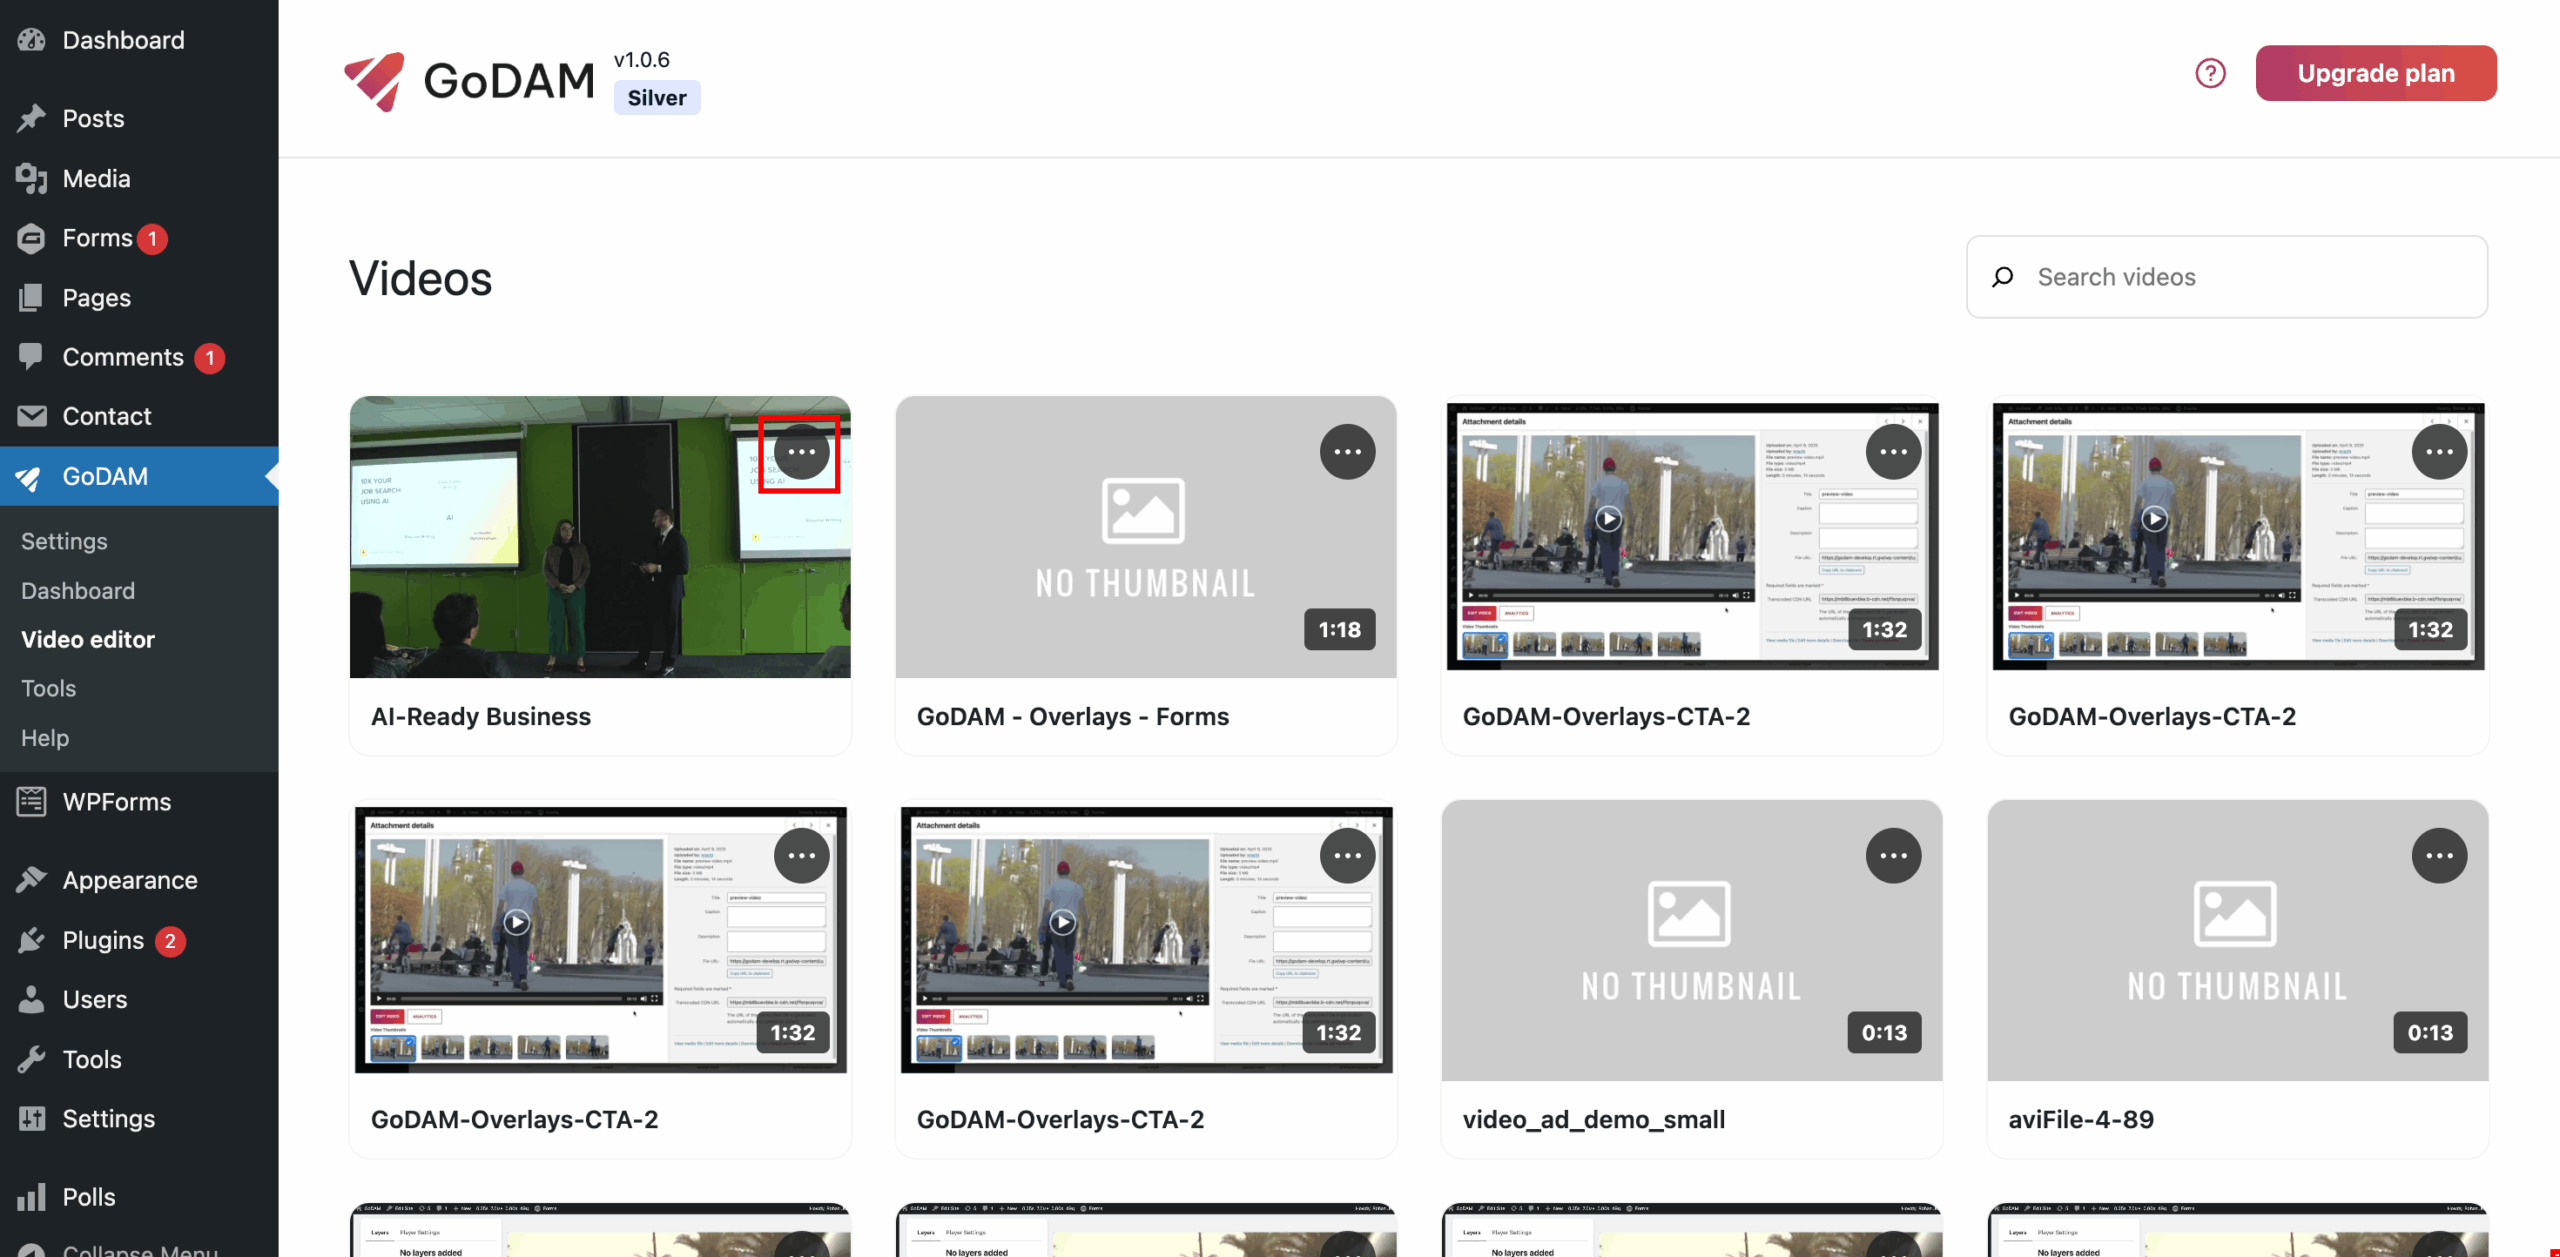
Step 3: Click on View Analytics
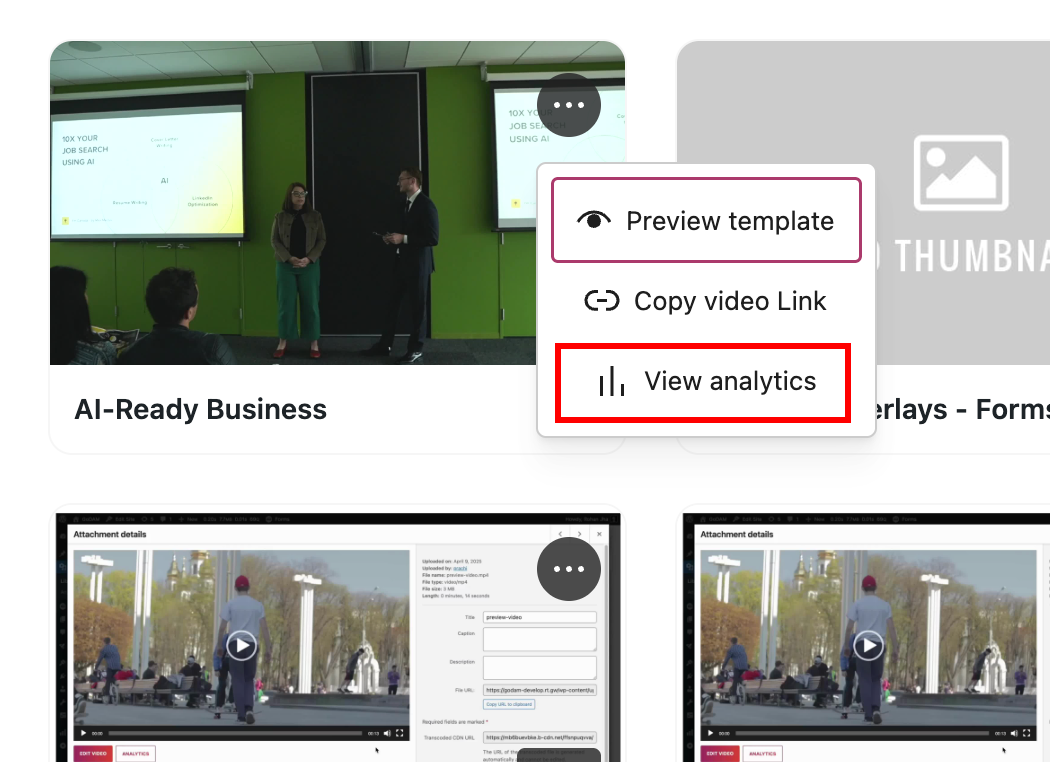
Step 4: You will be redirected to Analytics screen for this video.
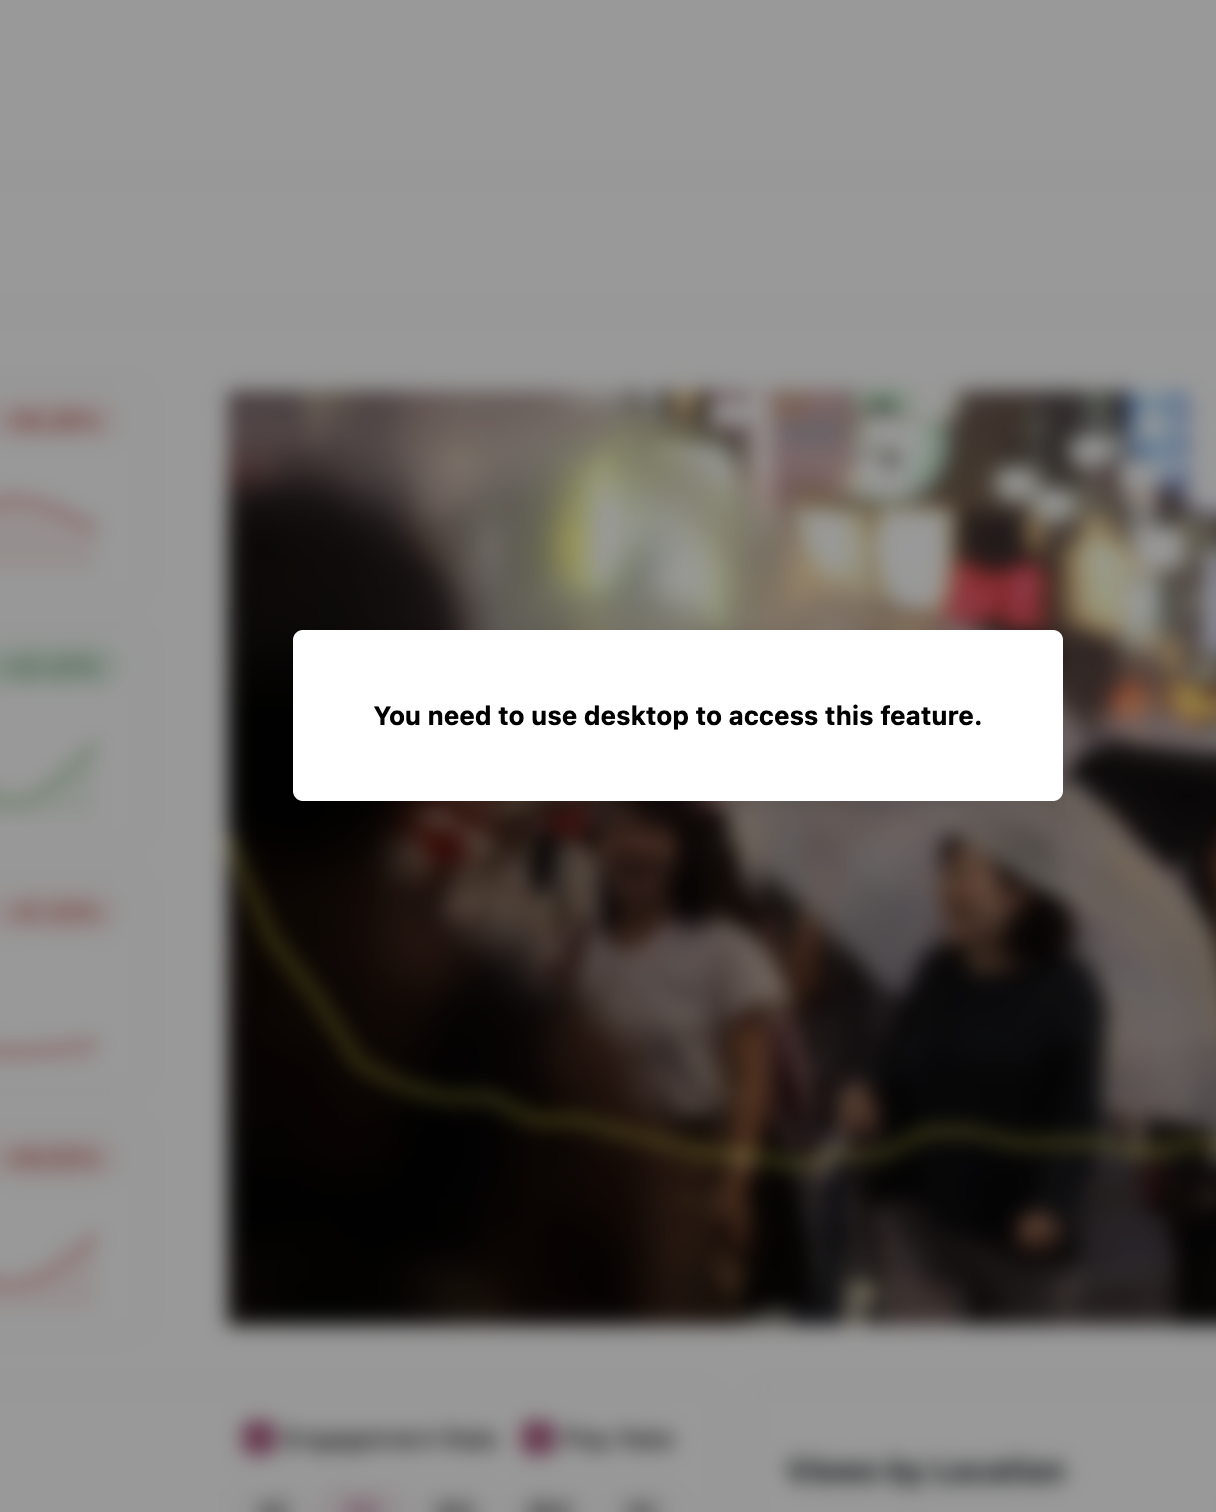
Note: You need to use Desktop to access this feature or you’ll see the below popup:
Zoom in on Single Video Performance
Click into any video to get deep, contextual insights:
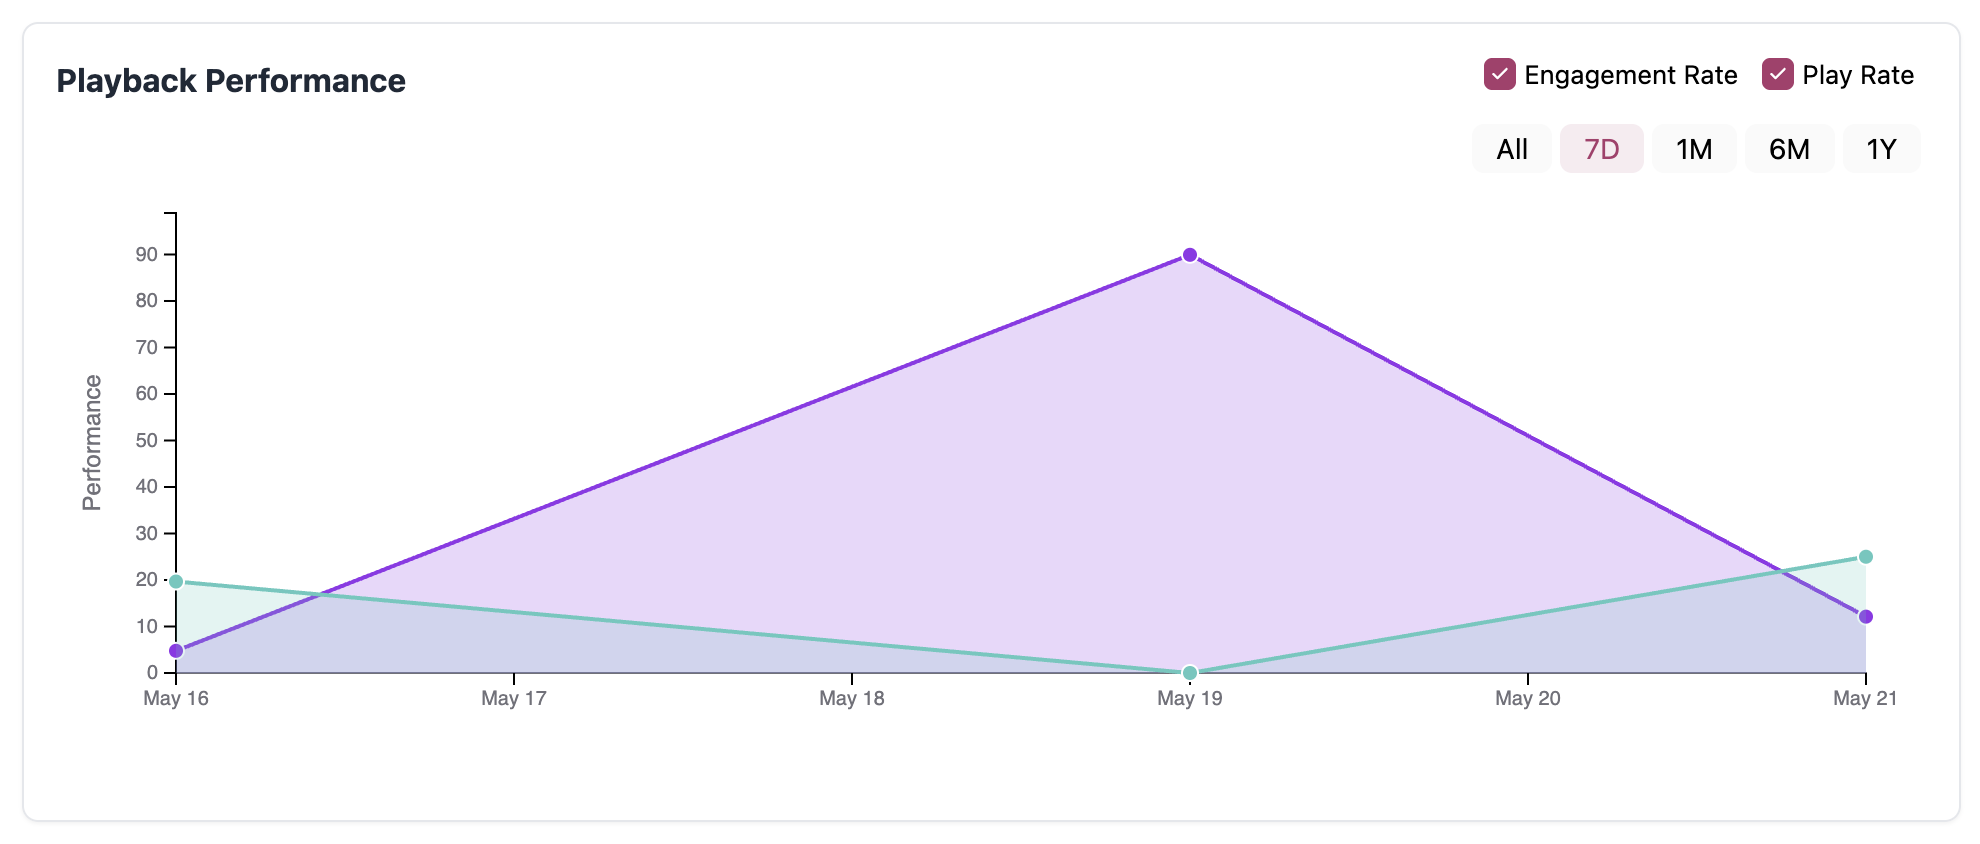
Playback Performance
This section displays detailed line charts that track changes in Engagement Rate and Play Rate on a daily basis, giving you a clear picture of how your videos are performing over time.
These charts help you make data-driven decisions by revealing how specific actions or events affect viewer behavior.
It is similar to the graph on dashboard, the major difference is that here the data is confined to the video of which you’re watching the analytics while the dashboard contains aggregated data for all the videos integrated using our GoDAM block.
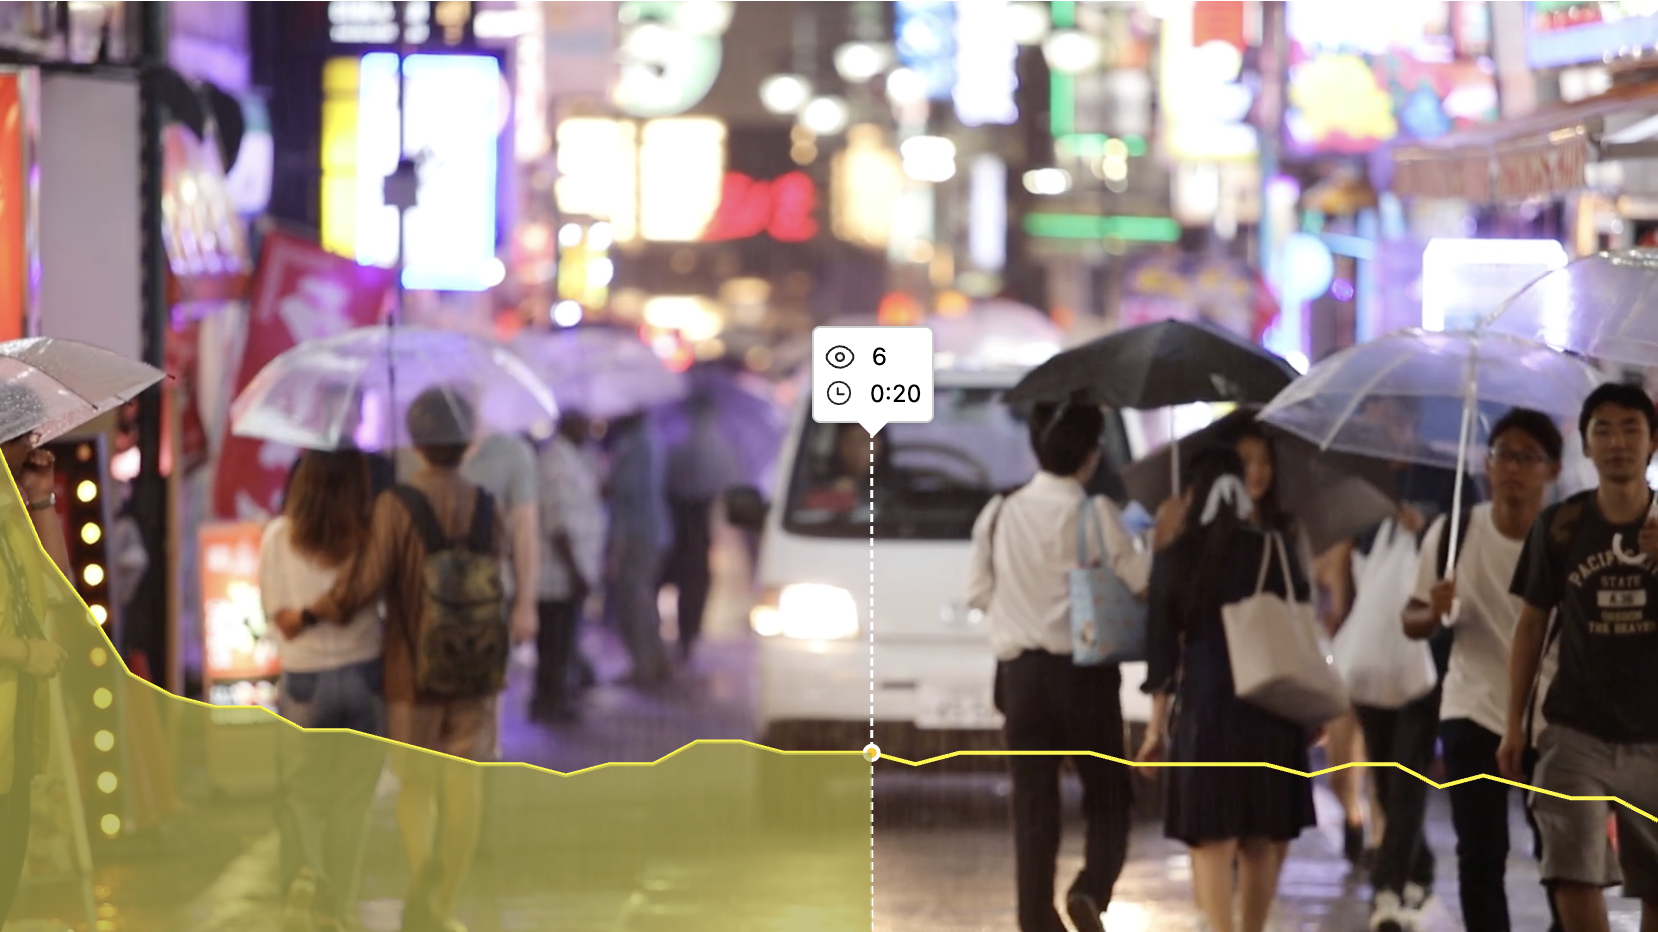
HeatMap Overlay
The Heatmap Overlay is your video’s engagement fingerprint, it visually maps where viewers are watching, rewatching, or skipping throughout the video timeline.
As shown in screenshot, it displays the views received at each timestamp along with visually displaying a linear chart with peaks and troughs at high and low views respectively.
Why it matters:
It’s like having a built-in focus group for every video. The Heatmap helps you understand real viewer behavior beyond total plays or watch time.
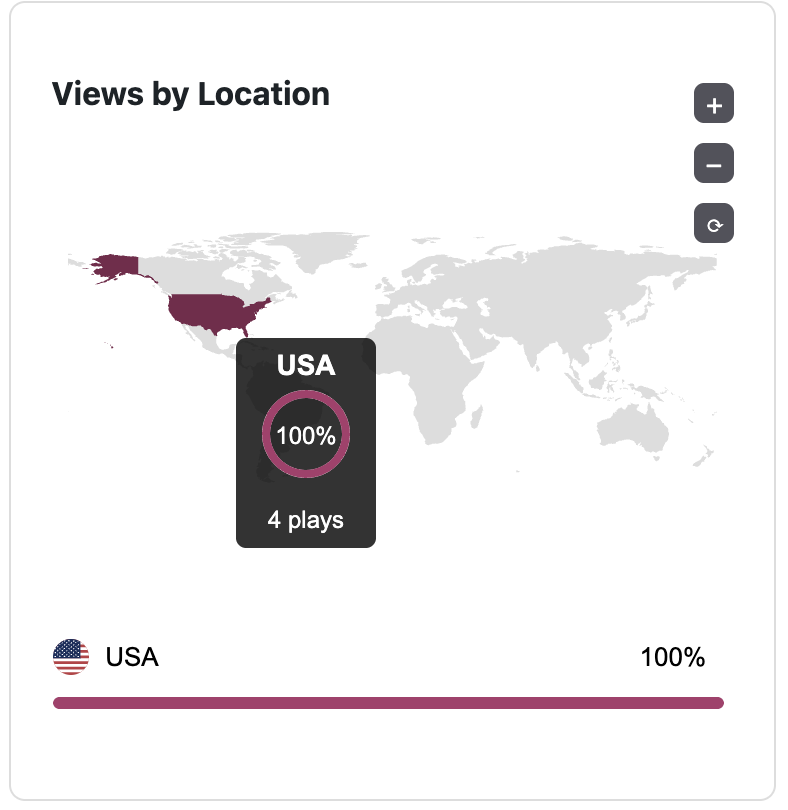
Geographic Intelligence
This feature tracks which regions engage most with your video content, helping you make smarter, more targeted decisions for future campaigns and content development.
Why it matters:
It’s not just about where views are coming from, it’s about understanding where your content truly connects. Regional engagement data helps you fine-tune your messaging, delivery, and even compliance strategies.
It is similar to the Geographical HeatMap on dashboard, you can refer this for more information. The major difference is that here the data is confined to the video of which you’re watching the analytics while the dashboard contains aggregated data for all the videos integrated using our GoDAM block.
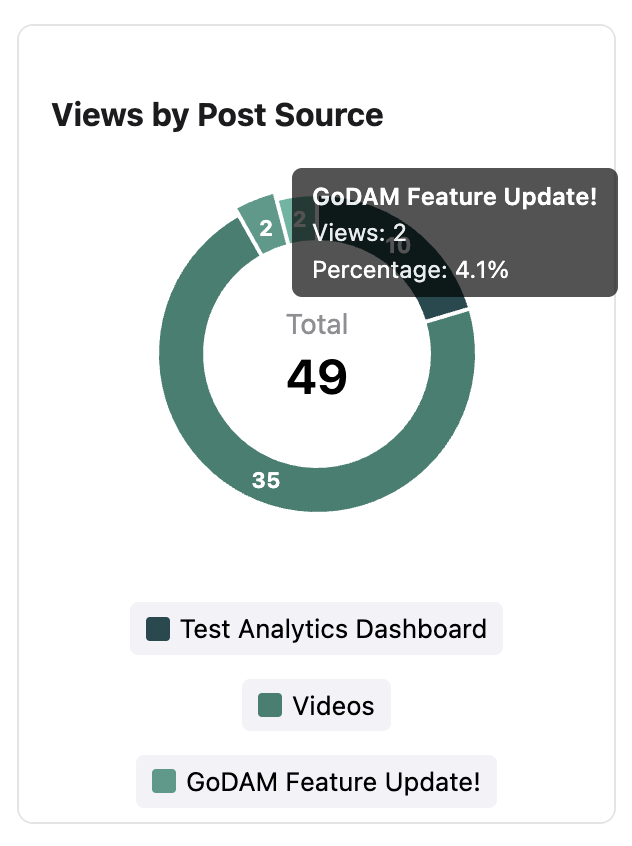
Source attribution
See exactly which blog posts, landing pages, or product pages drive the most video views. The doughnut is divided into sections based on how much percentage of views have been received by each section. The number at the middle describes the total views received for the specific video from all the posts where it has been integrated using our GoDAM block.
In cases where you don’t provide the title to a post, it will be displayed as Untitled.
In the legend, along with color coding information, it contains the title as link for the posts where the video has been embedded.
Why it matters:
Not all page placements are equal. Understanding where your videos perform best helps you strategically embed content for maximum impact.
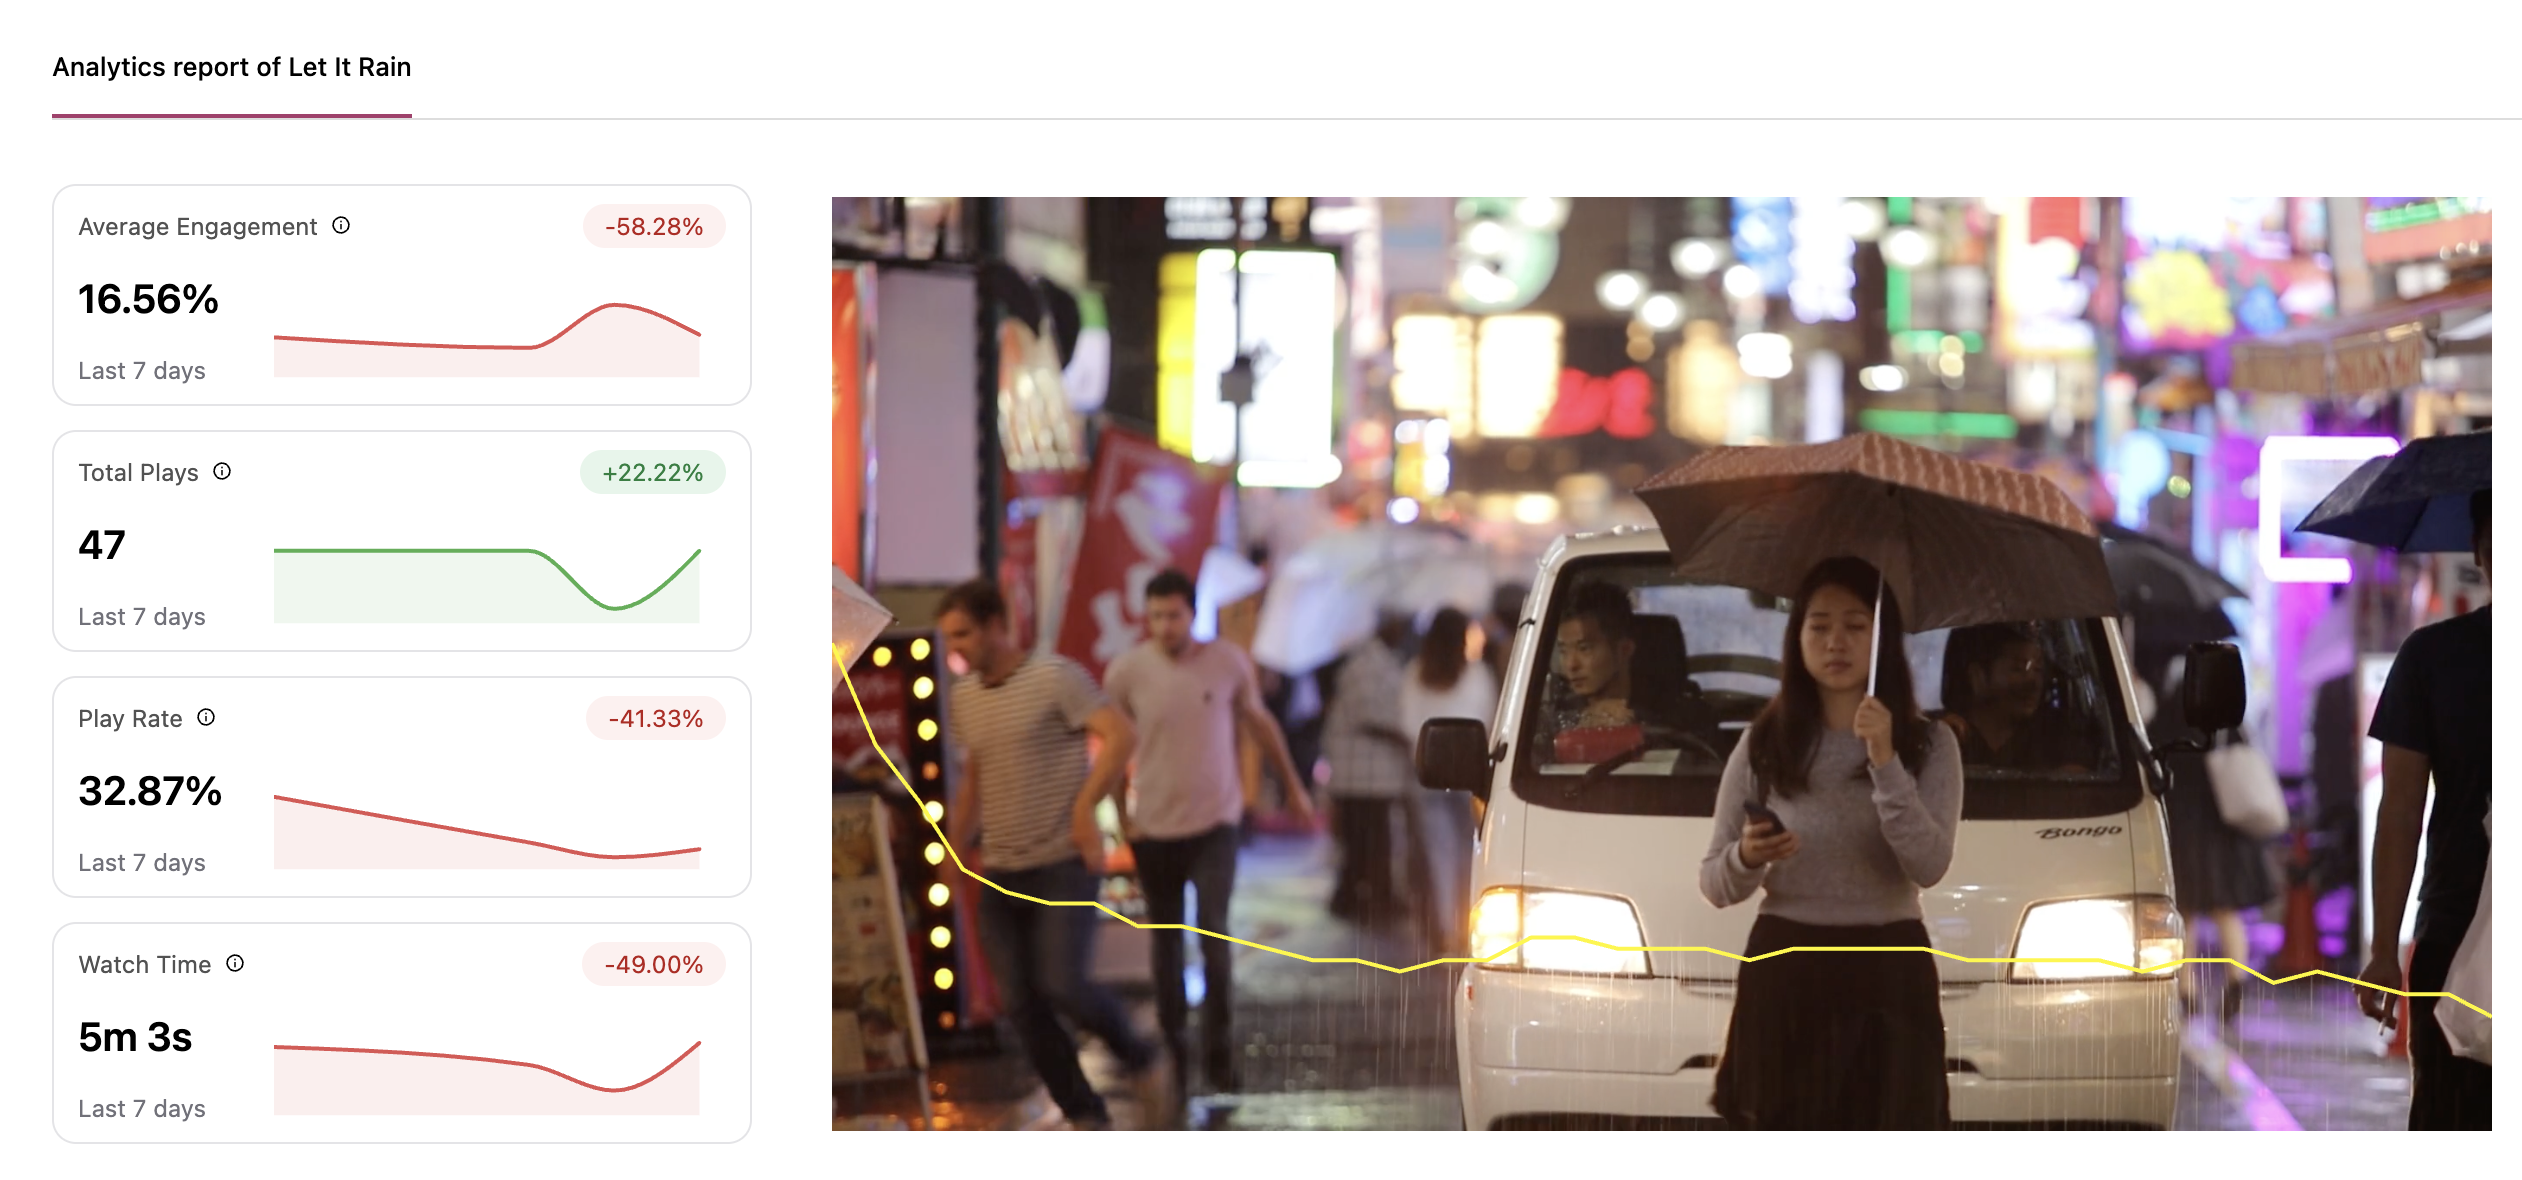
Performance Metrics Updated Every 7 Days
Data metrics like total videos, plays, watch time, completion rates etc. displayed for all the videos across your site gets regularly updated every 7 days with numerical stats and visual graphs help you quickly gauge audience reaction and make informed decisions.
This includes following metrics:
Average Engagement: It measures how much of your video viewers actually watch on average, expressed as a percentage. It shows the average portion of your video that’s being watched across all viewers. This metric gives you a deeper understanding of viewer interest and retention. High play counts are great, but high engagement means people are actually staying and watching your content.
Total Plays: Refers to the total number of views received for the specific video from all the places where it has been integrated using our GoDAM block.
Play Rate: Play Rate measures the percentage of visitors who clicked Play on a video after it loaded on a page. Play Rate tells you how compelling your video thumbnail, title, and placement are. A low play rate may indicate that your video isn’t grabbing attention or that it’s not well-positioned on the page.
Watch Time: Watch Time refers to the total duration that viewers have collectively spent watching all the videos.
Watch Time helps you understand overall viewer interest and retention. It’s especially valuable for measuring long-form content performance or comparing how much time viewers invest in different videos.
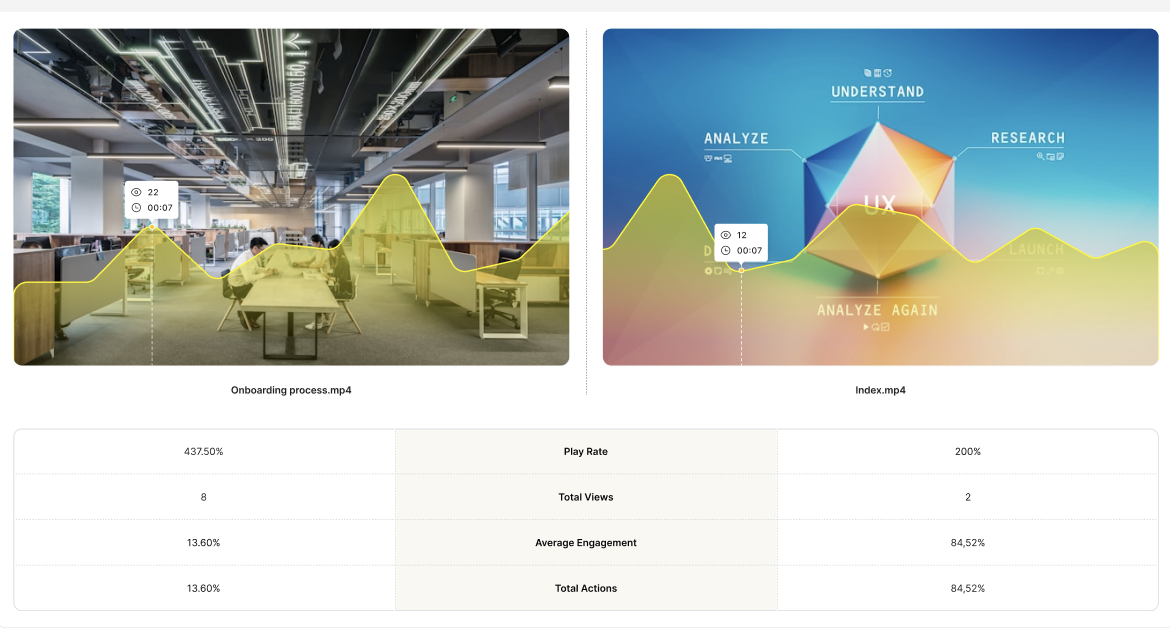
Compare Content Side-by-Side
Want to know which content performs best? GoDAM’s Performance Comparison tool in GoDAM lets you visually compare the key performance metrics of multiple videos side by side. It’s your go-to feature for understanding which content truly resonates with your audience.
Why it matters:
This tool gives you actionable insights to guide content decisions. Whether you’re optimizing an onboarding video, refining a marketing campaign, or updating training material, Performance Comparison helps you pick the winning strategy. If your newer training video has a 200% play rate and 84.52% engagement, while the older version shows only 13.62% engagement, that’s a clear signal to revise or replace the underperforming version.
Pro tip:
Use Performance Comparison alongside Heatmaps and Playback Performance to get both macro and micro-level insights into your video content