GoDAM Dashboard Analytics provides a complete overview of your video performance, showing viewer behavior, engagement patterns, and content trends across all videos. Track key metrics such as play rates, engagement rates, and top-performing pages all from your WordPress dashboard to understand what drives engagement and make data-backed decisions.
Steps to access the GoDAM Dashboard Analytics
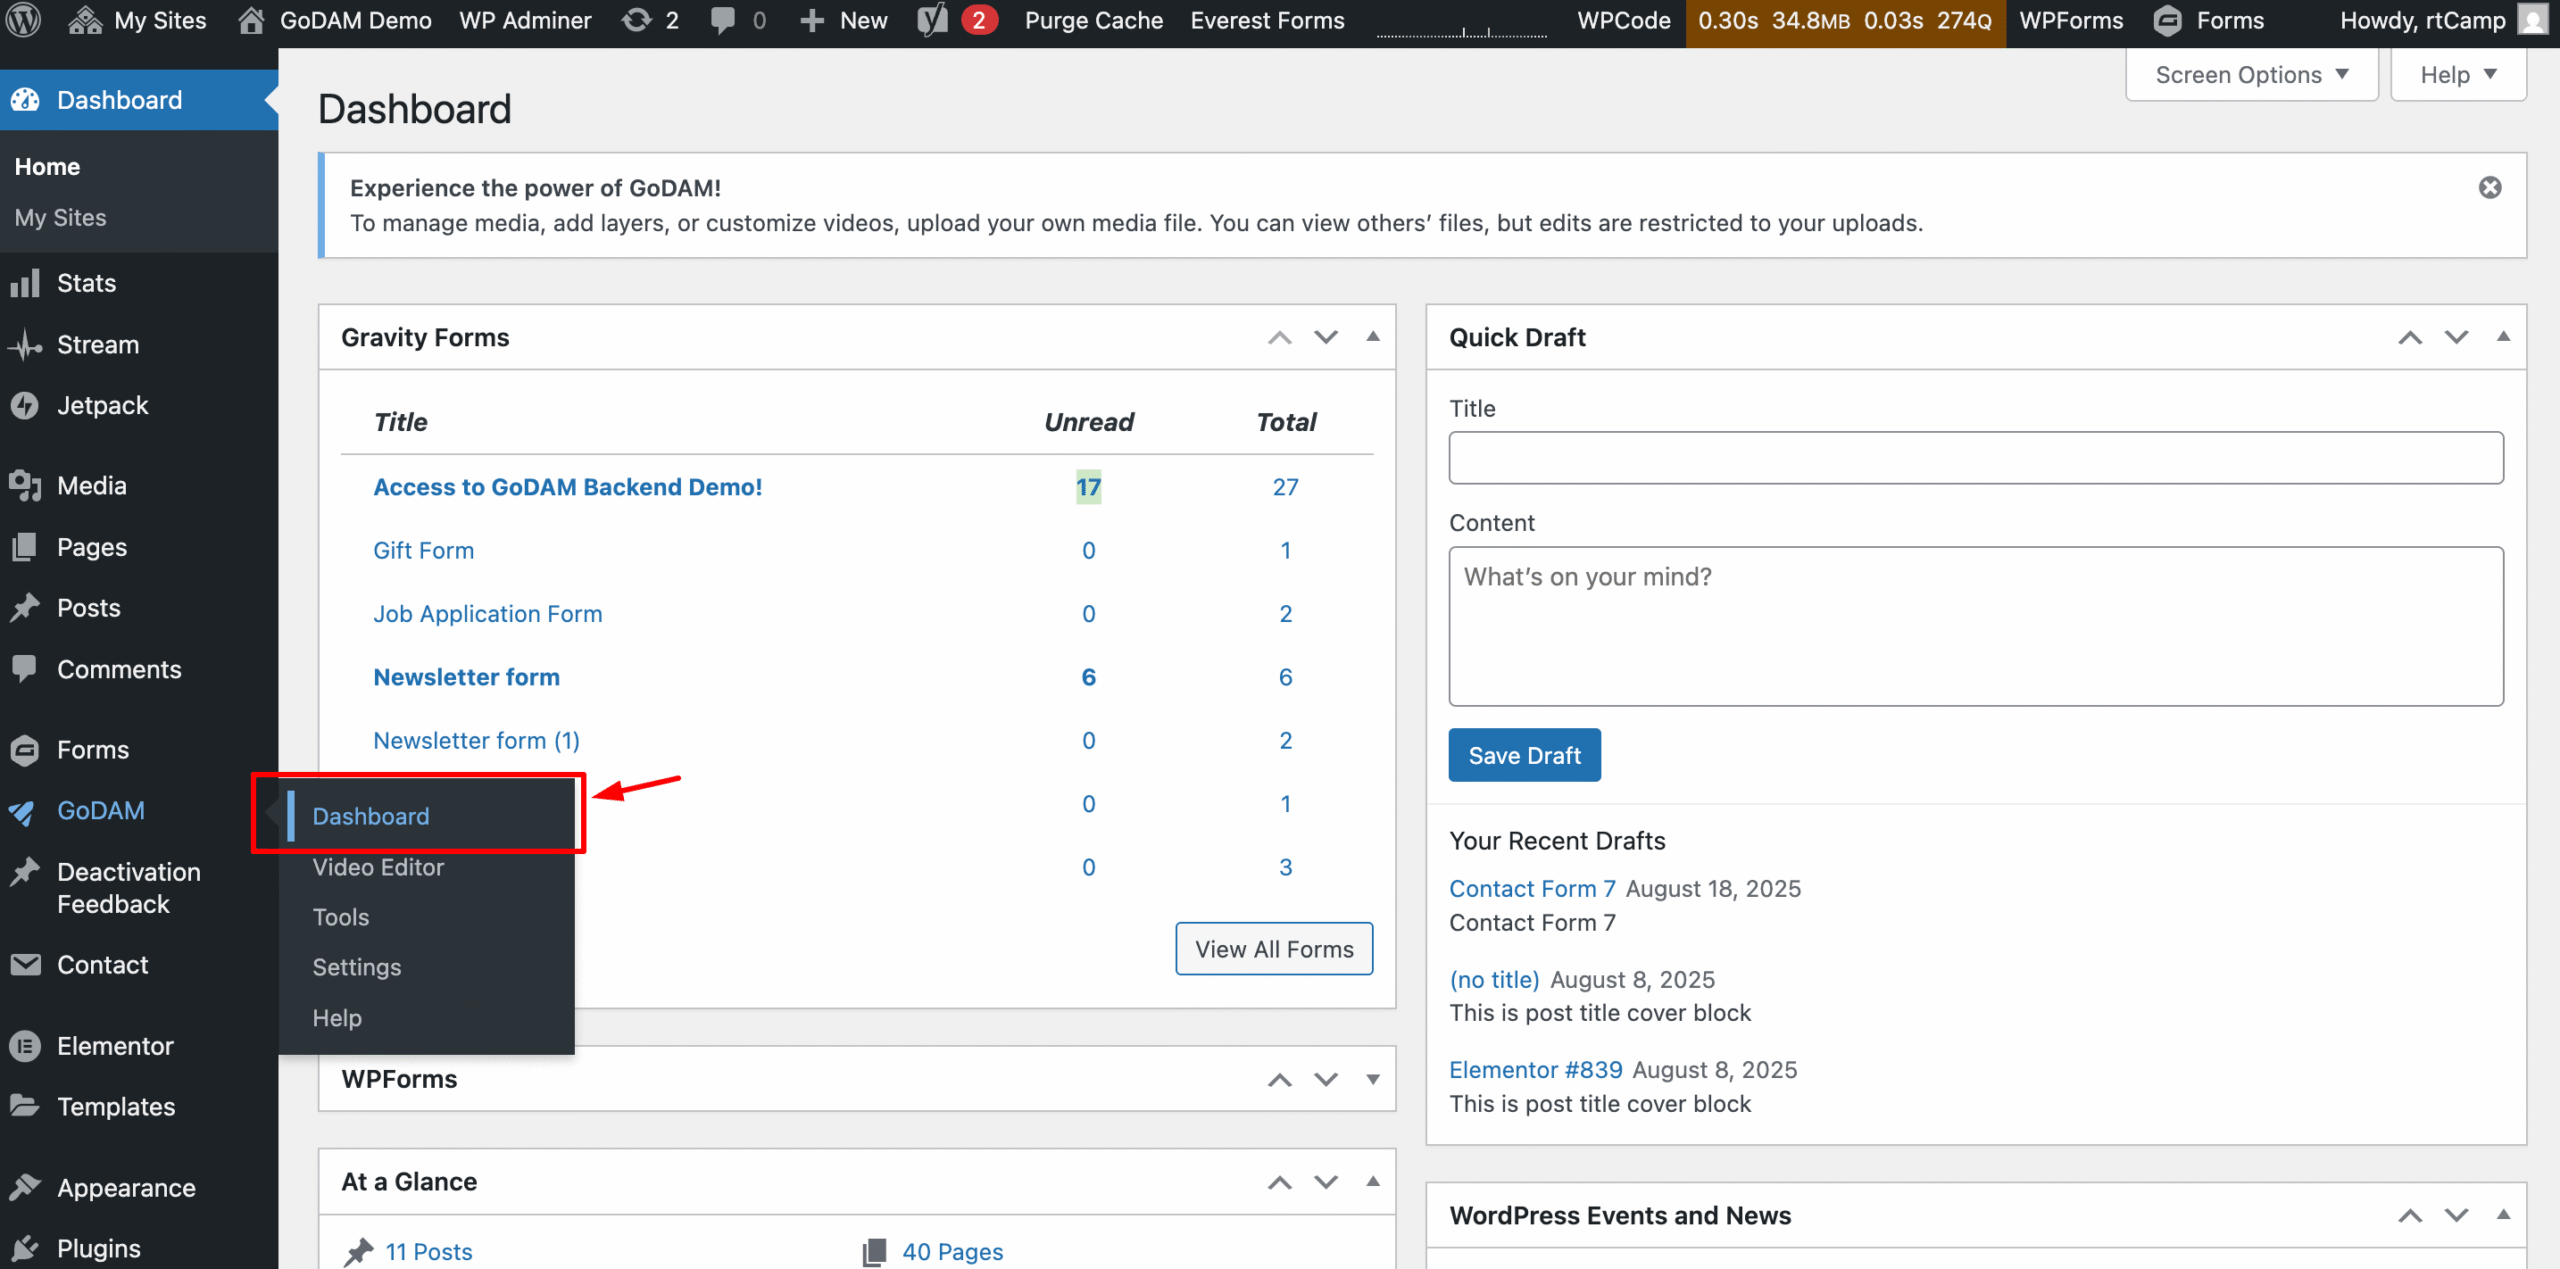
Navigate to GoDAM → Dashboard
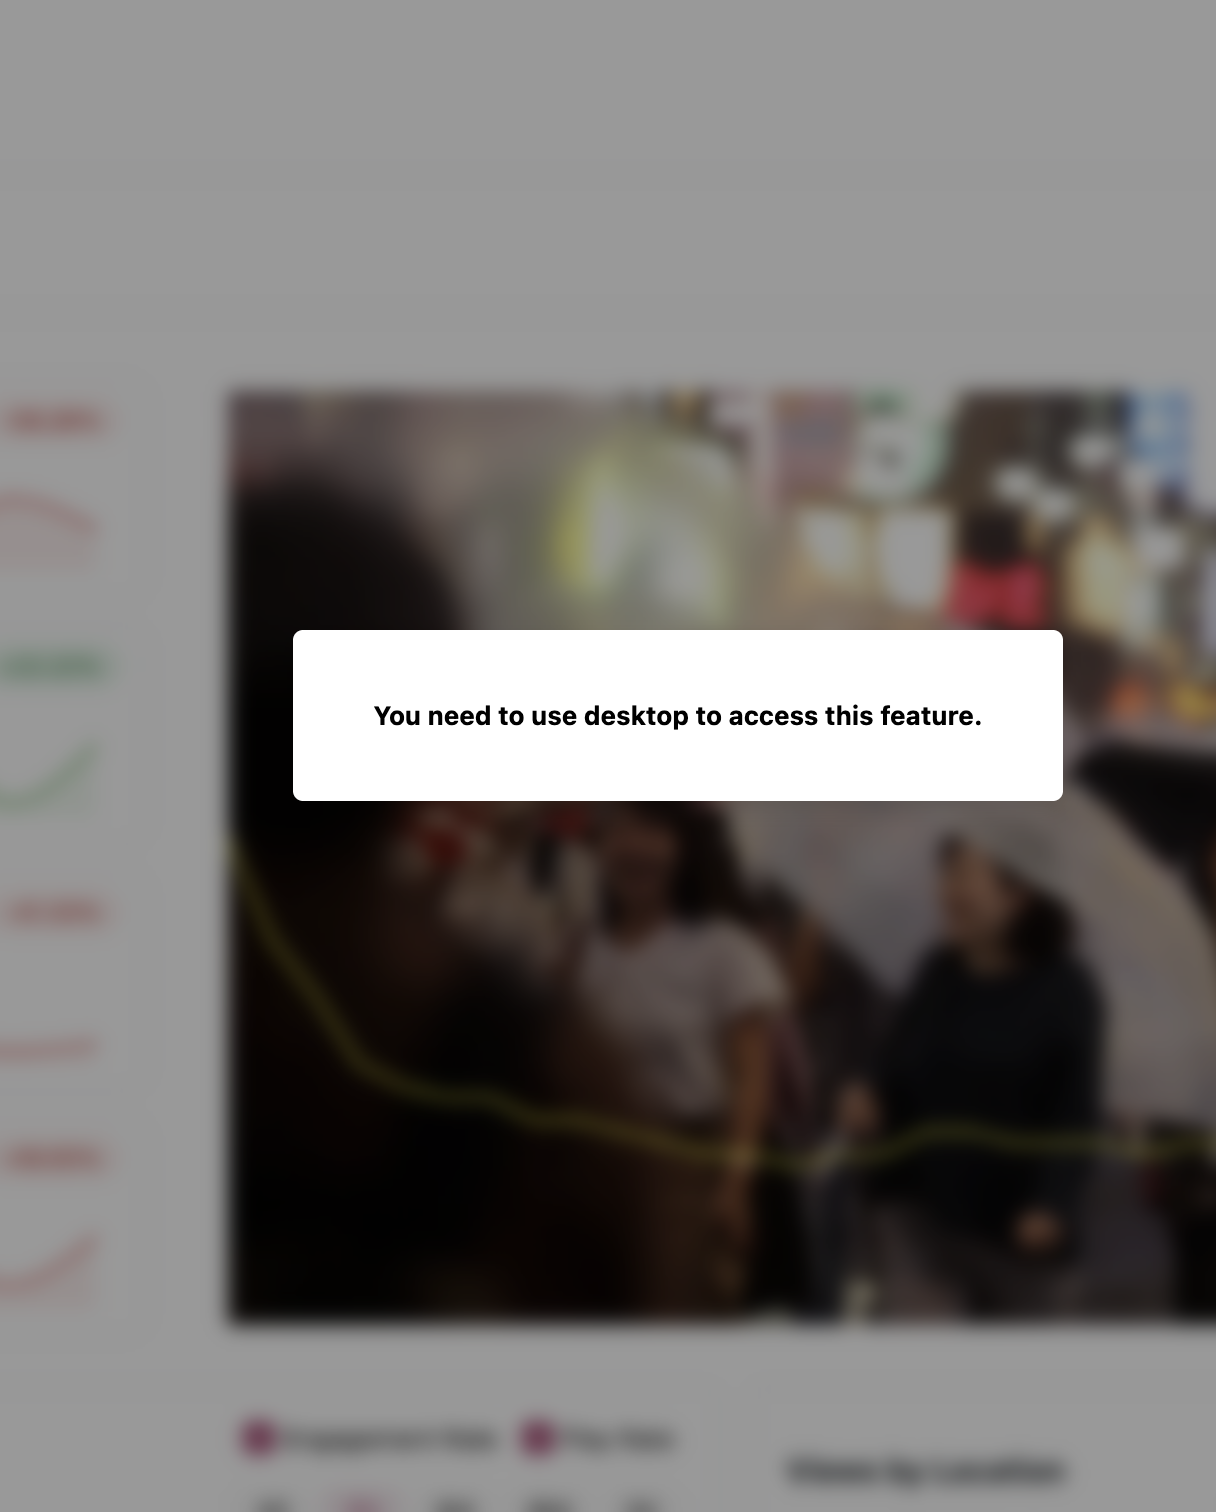
Note: You need to use Desktop to access this feature or you’ll see the below popup:
The GoDAM Dashboard offers a panoramic view of your video ecosystem:
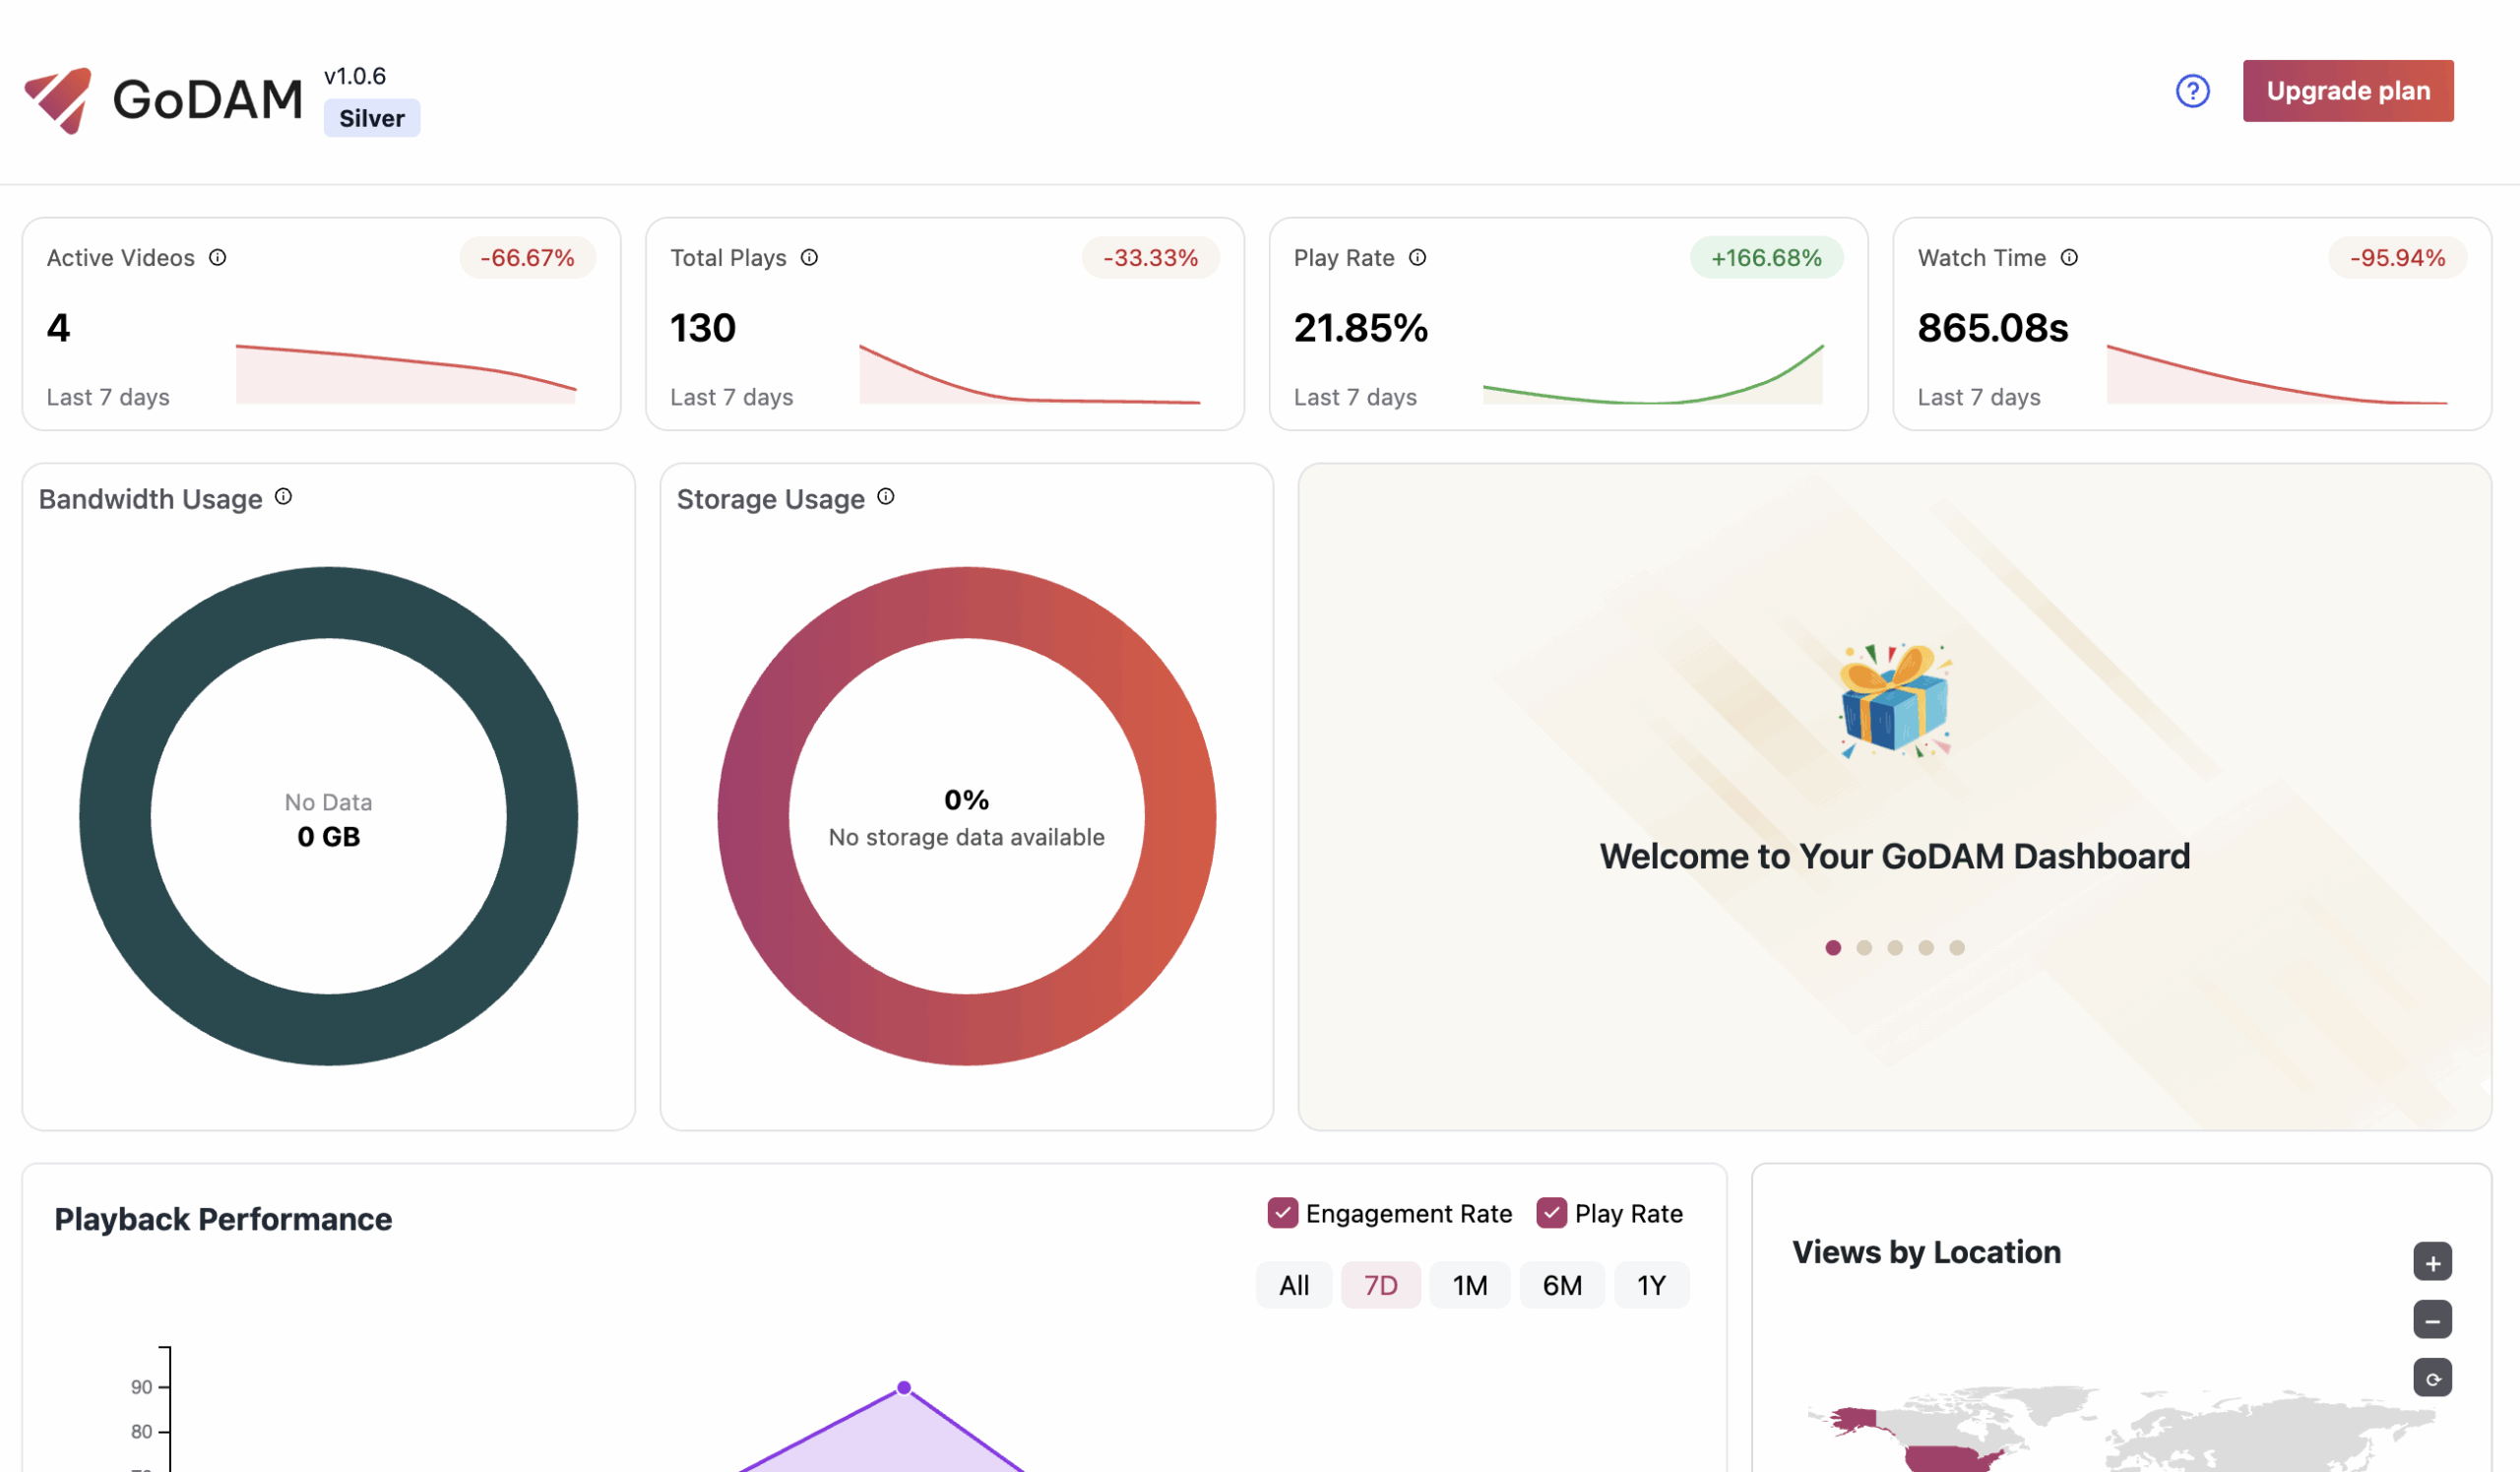
Performance Metrics Updated Every 7 Days
Gain insights into your video library with metrics updated every 7 days, including:
Active Videos: Active Videos refers to the number of unique videos that received at least one form of user interaction per day, tracked over the selected time range (e.g., last 7 days). Interaction such as Video plays, seeks, resumes, plays etc. helps you understand how many of your videos are actively engaging viewers. A higher number indicates broader interest across your video library, while a drop may suggest the need to promote or refresh underperforming content.
Total Plays: Refers to the total number of views received for all the videos integrated using our GoDAM block.
Play Rate: Play Rate measures the percentage of visitors who clicked Play on a video after it loaded on a page. Play Rate tells you how compelling your video thumbnail, title, and placement are. A low play rate may indicate that your video isn’t grabbing attention or that it’s not well-positioned on the page.
Total Watch Time: Watch Time refers to the total duration that viewers have collectively spent watching all the videos.
Watch Time helps you understand overall viewer interest and retention. It’s especially valuable for measuring long-form content performance or comparing how much time viewers invest in different videos.
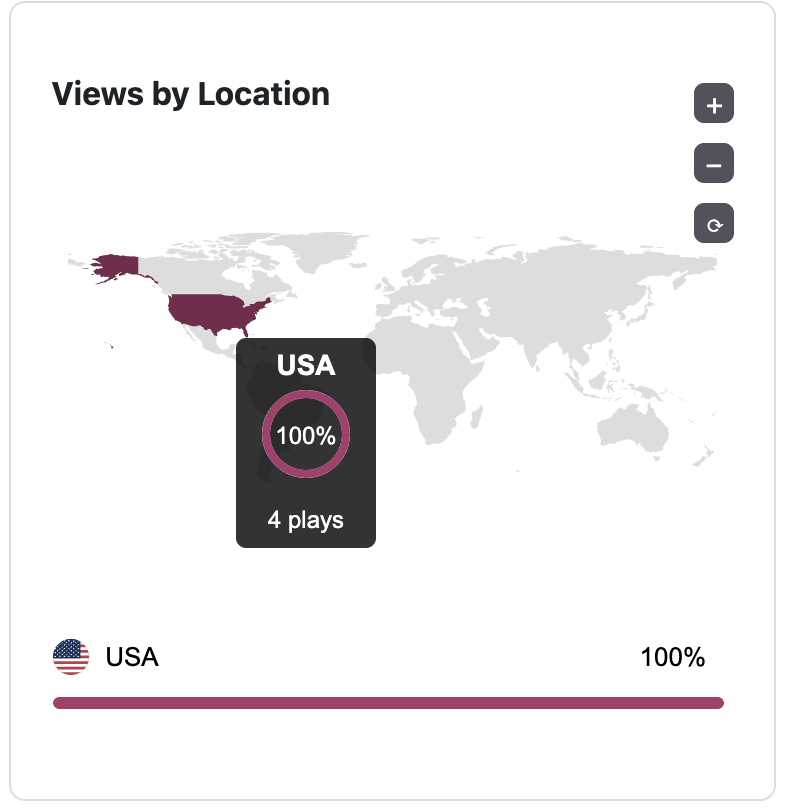
Geographic Viewer Mapping
The Geographical Map visualizes where your video viewers are located across the globe. It highlights regions based on viewer activity such as plays, interactions, or engagement levels.
How it works:
Each region is color-coded based on the volume of video interactions coming from that location. The darker the shade, the higher the number of interactions from that area. The tooltip includes the percentage of views received from that country from the total views. It also contains non percentage value of the views received from the country.
Why it matters:
Understanding where your audience is coming from helps tailor your content strategy. For example, if you’re seeing high engagement from a specific region, you might consider optimizing content for that market or adjusting your posting schedule to align with their time zone.
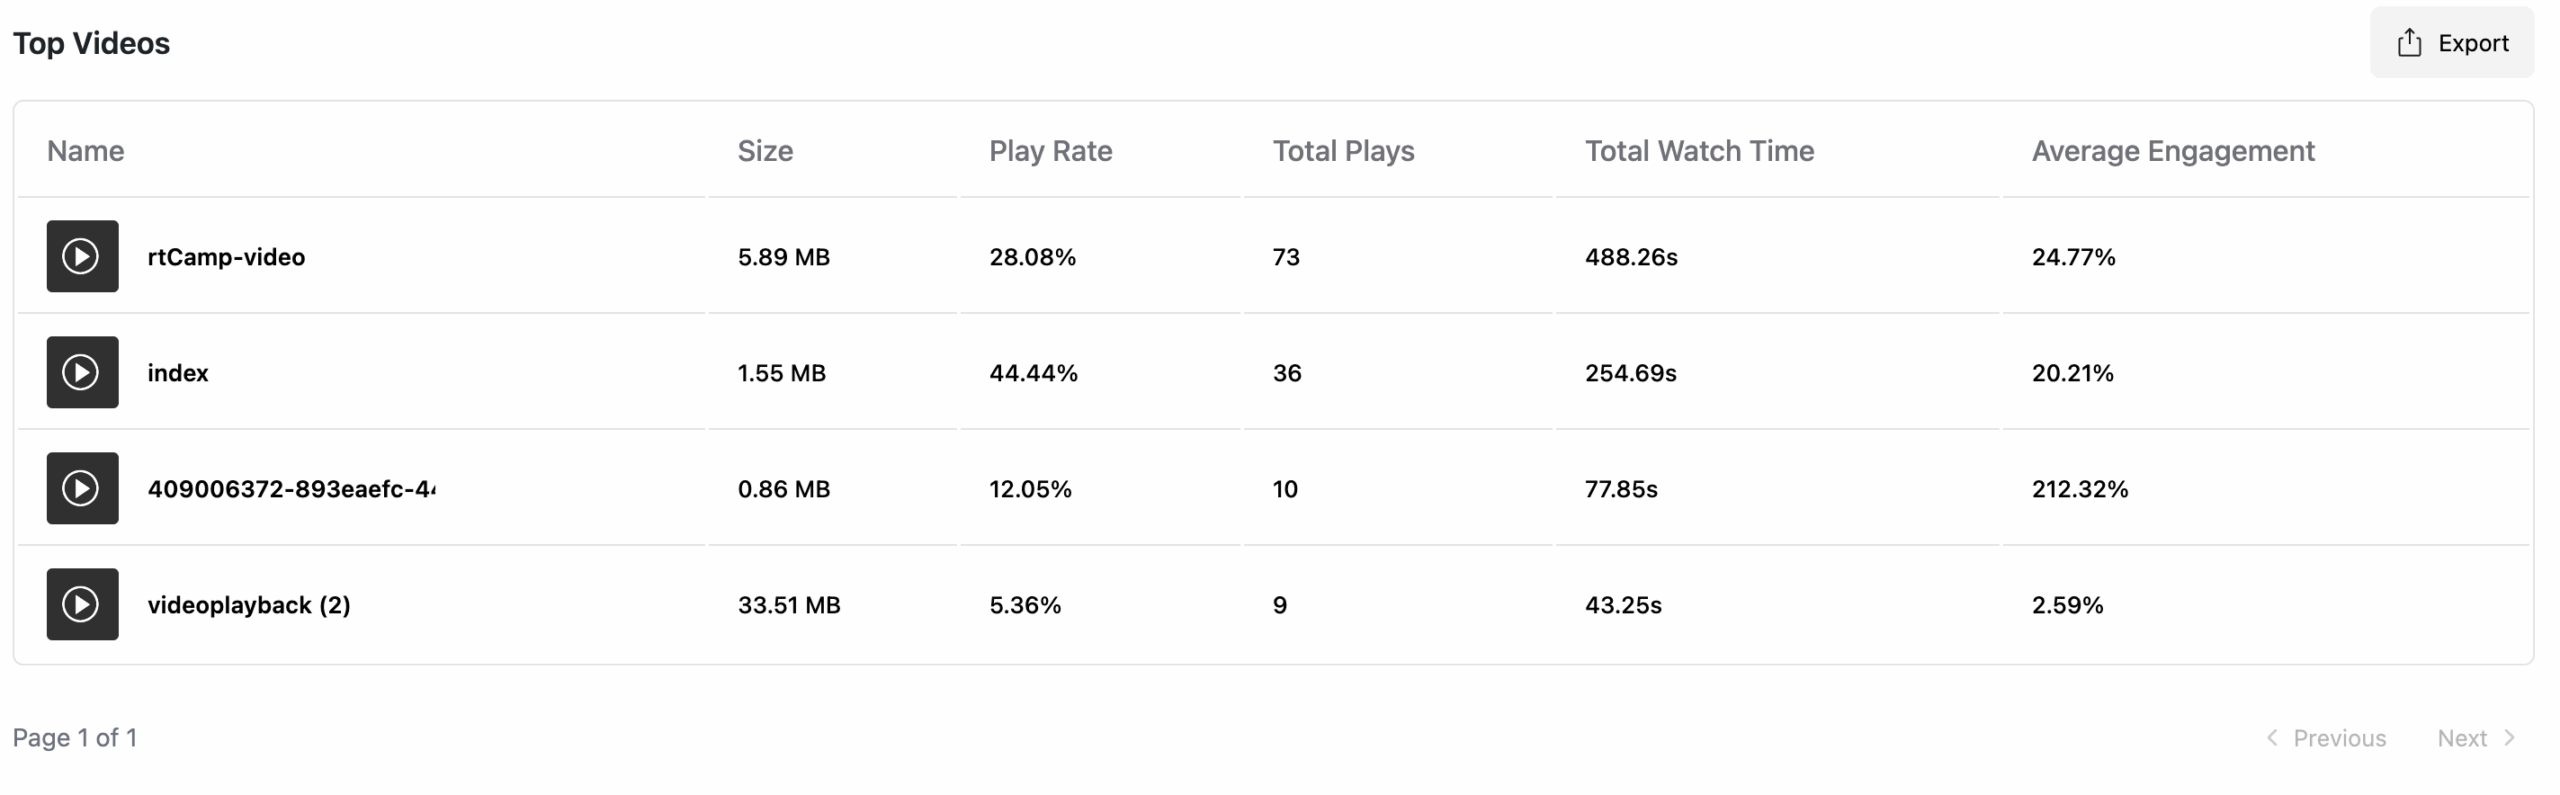
Top Performing Videos at a glance
The Top Performing Videos section highlights the videos on your site that are generating the highest levels of viewer engagement and interaction over the selected time period. It is like a sorted list of all videos on the basis of performance.
Why it matters:
Identifying your best-performing videos helps you understand what type of content resonates most with your audience. These insights can guide future content decisions, marketing strategies, and video optimization efforts.
The Export button, located at the top right of the Analytics Dashboard, allows you to download a comprehensive report of your video performance data. When clicked, it exports all available analytics fields for all videos in .xls (Excel) format. This includes metrics like Video Title, Size, Play Rate, Total Plays. Total Watch Time, Average Engagement etc. This makes it easy to integrate data into custom reports or business dashboards, conduct deeper analysis, share insights with your team or stakeholders.
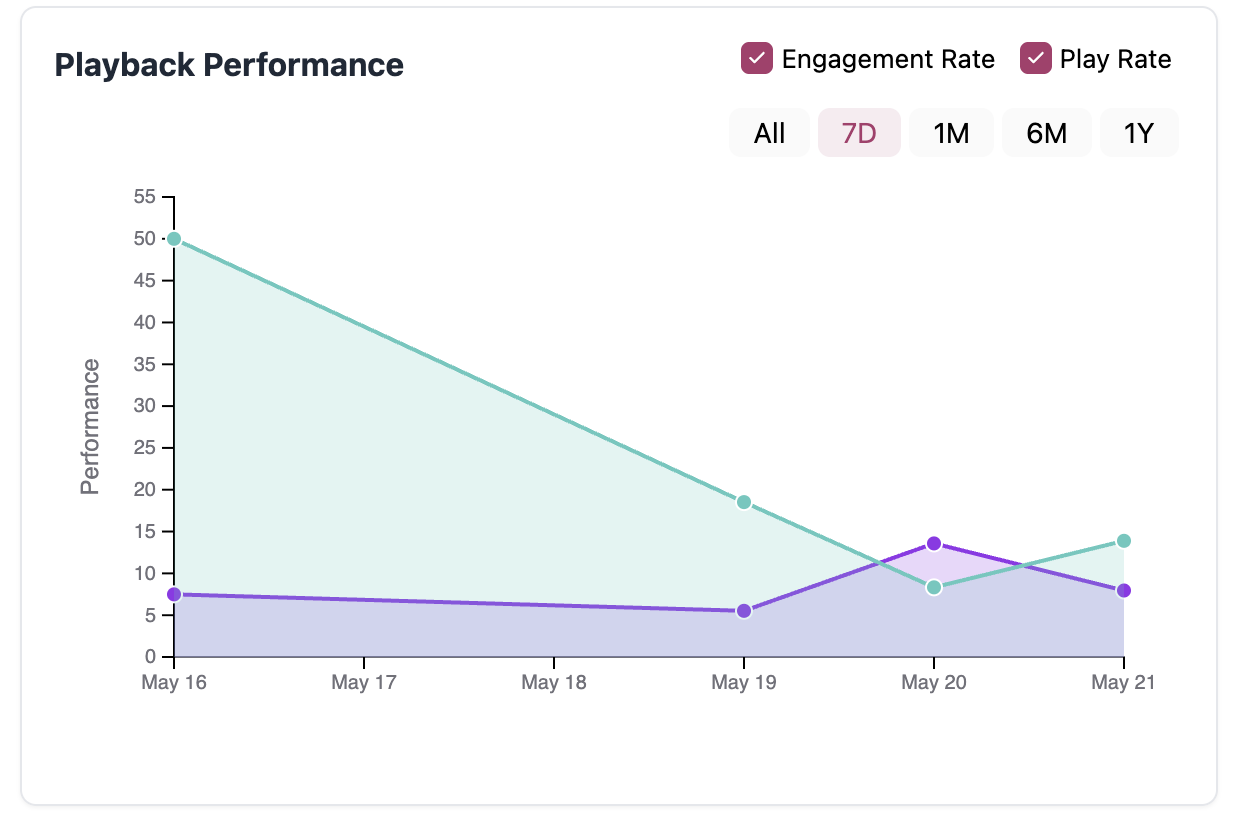
Playback Performance
The Playback Performance section provides clear, visual insights into how your videos are performing over time, specifically tracking Engagement Rate and Play Rate.
Interactive graphs display how these key metrics fluctuate across different time ranges, allowing you to easily monitor performance trends. You can switch between Overall, Last 7 days, Last 1 Month, Last 6 Months, Last 1 Year respectively.
You can also switch between which metrics you want to see specifically by selecting or unselecting the metrics at the top.
Why it matters:
These time-based comparisons help you understand the impact of changes like video titles, thumbnails, or placement. For instance, if you recently updated a video’s title and image, you can check whether the Play Rate has increased over the last 7 days compared to the previous month.
Storage and Bandwidth
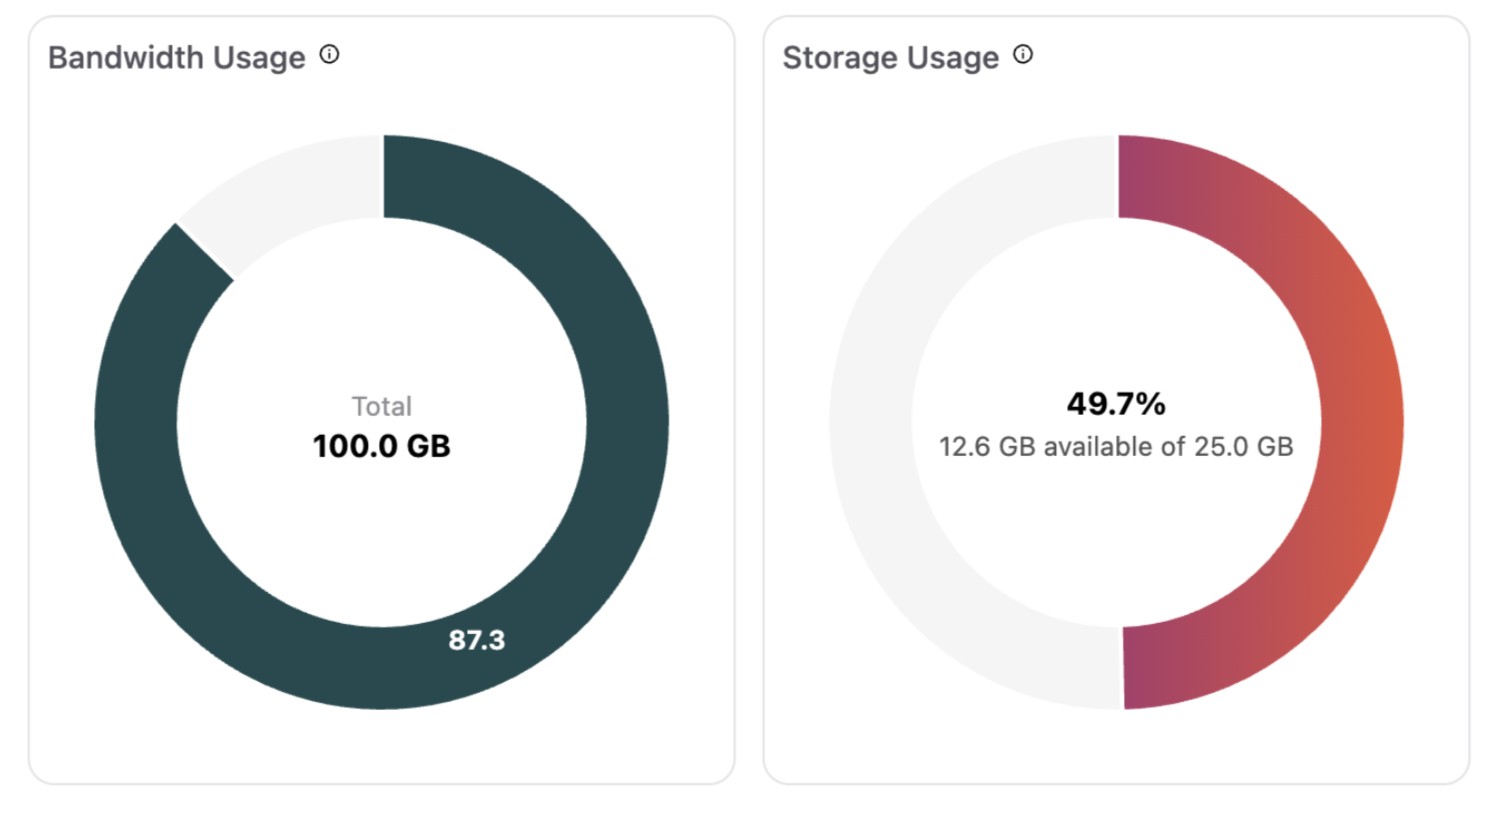
GoDAM also helps you stay in control of your resource usage with real-time insights into Bandwidth Usage and Storage Usage. These donut charts give you a quick, visual snapshot of how much you’re consuming, so you’re never caught off guard by overages or performance slowdowns.
Bandwidth Usage tracks how much data your videos have transferred to viewers over time. Whether you’re embedding videos across dozens of posts or sharing them externally, this helps you monitor streaming demand. A spike in bandwidth usage could signal a viral video or a need to optimize large files for better load times.
Storage Usage reflects the total space your media files are occupying on GoDAM. This helps you manage uploads smartly, stay within your limits, and keep your media library organized. If you’re pushing close to your quota, you’ll know it’s time to compress or archive older videos.