
GoDAM Video Analytics gives you a complete picture of how your videos are actually performing. You can see how many times people played them, how much of each video viewers watched, where those viewers are coming from, and which videos drive the most engagement across your library. Whether you want a bird’s-eye view of your whole library or a deep dive into one video, GoDAM Analytics has you covered.
Note: This doc covers analytics in GoDAM Central (the web app at app.godam.io. If you’re using the GoDAM WordPress plugin and want plugin-side analytics instead, see GoDAM WordPress Analytics Dashboard.
Steps to Access GoDAM Video Analytics
There are two places to view your analytics, depending on whether you want the big picture or a closer look at one video.
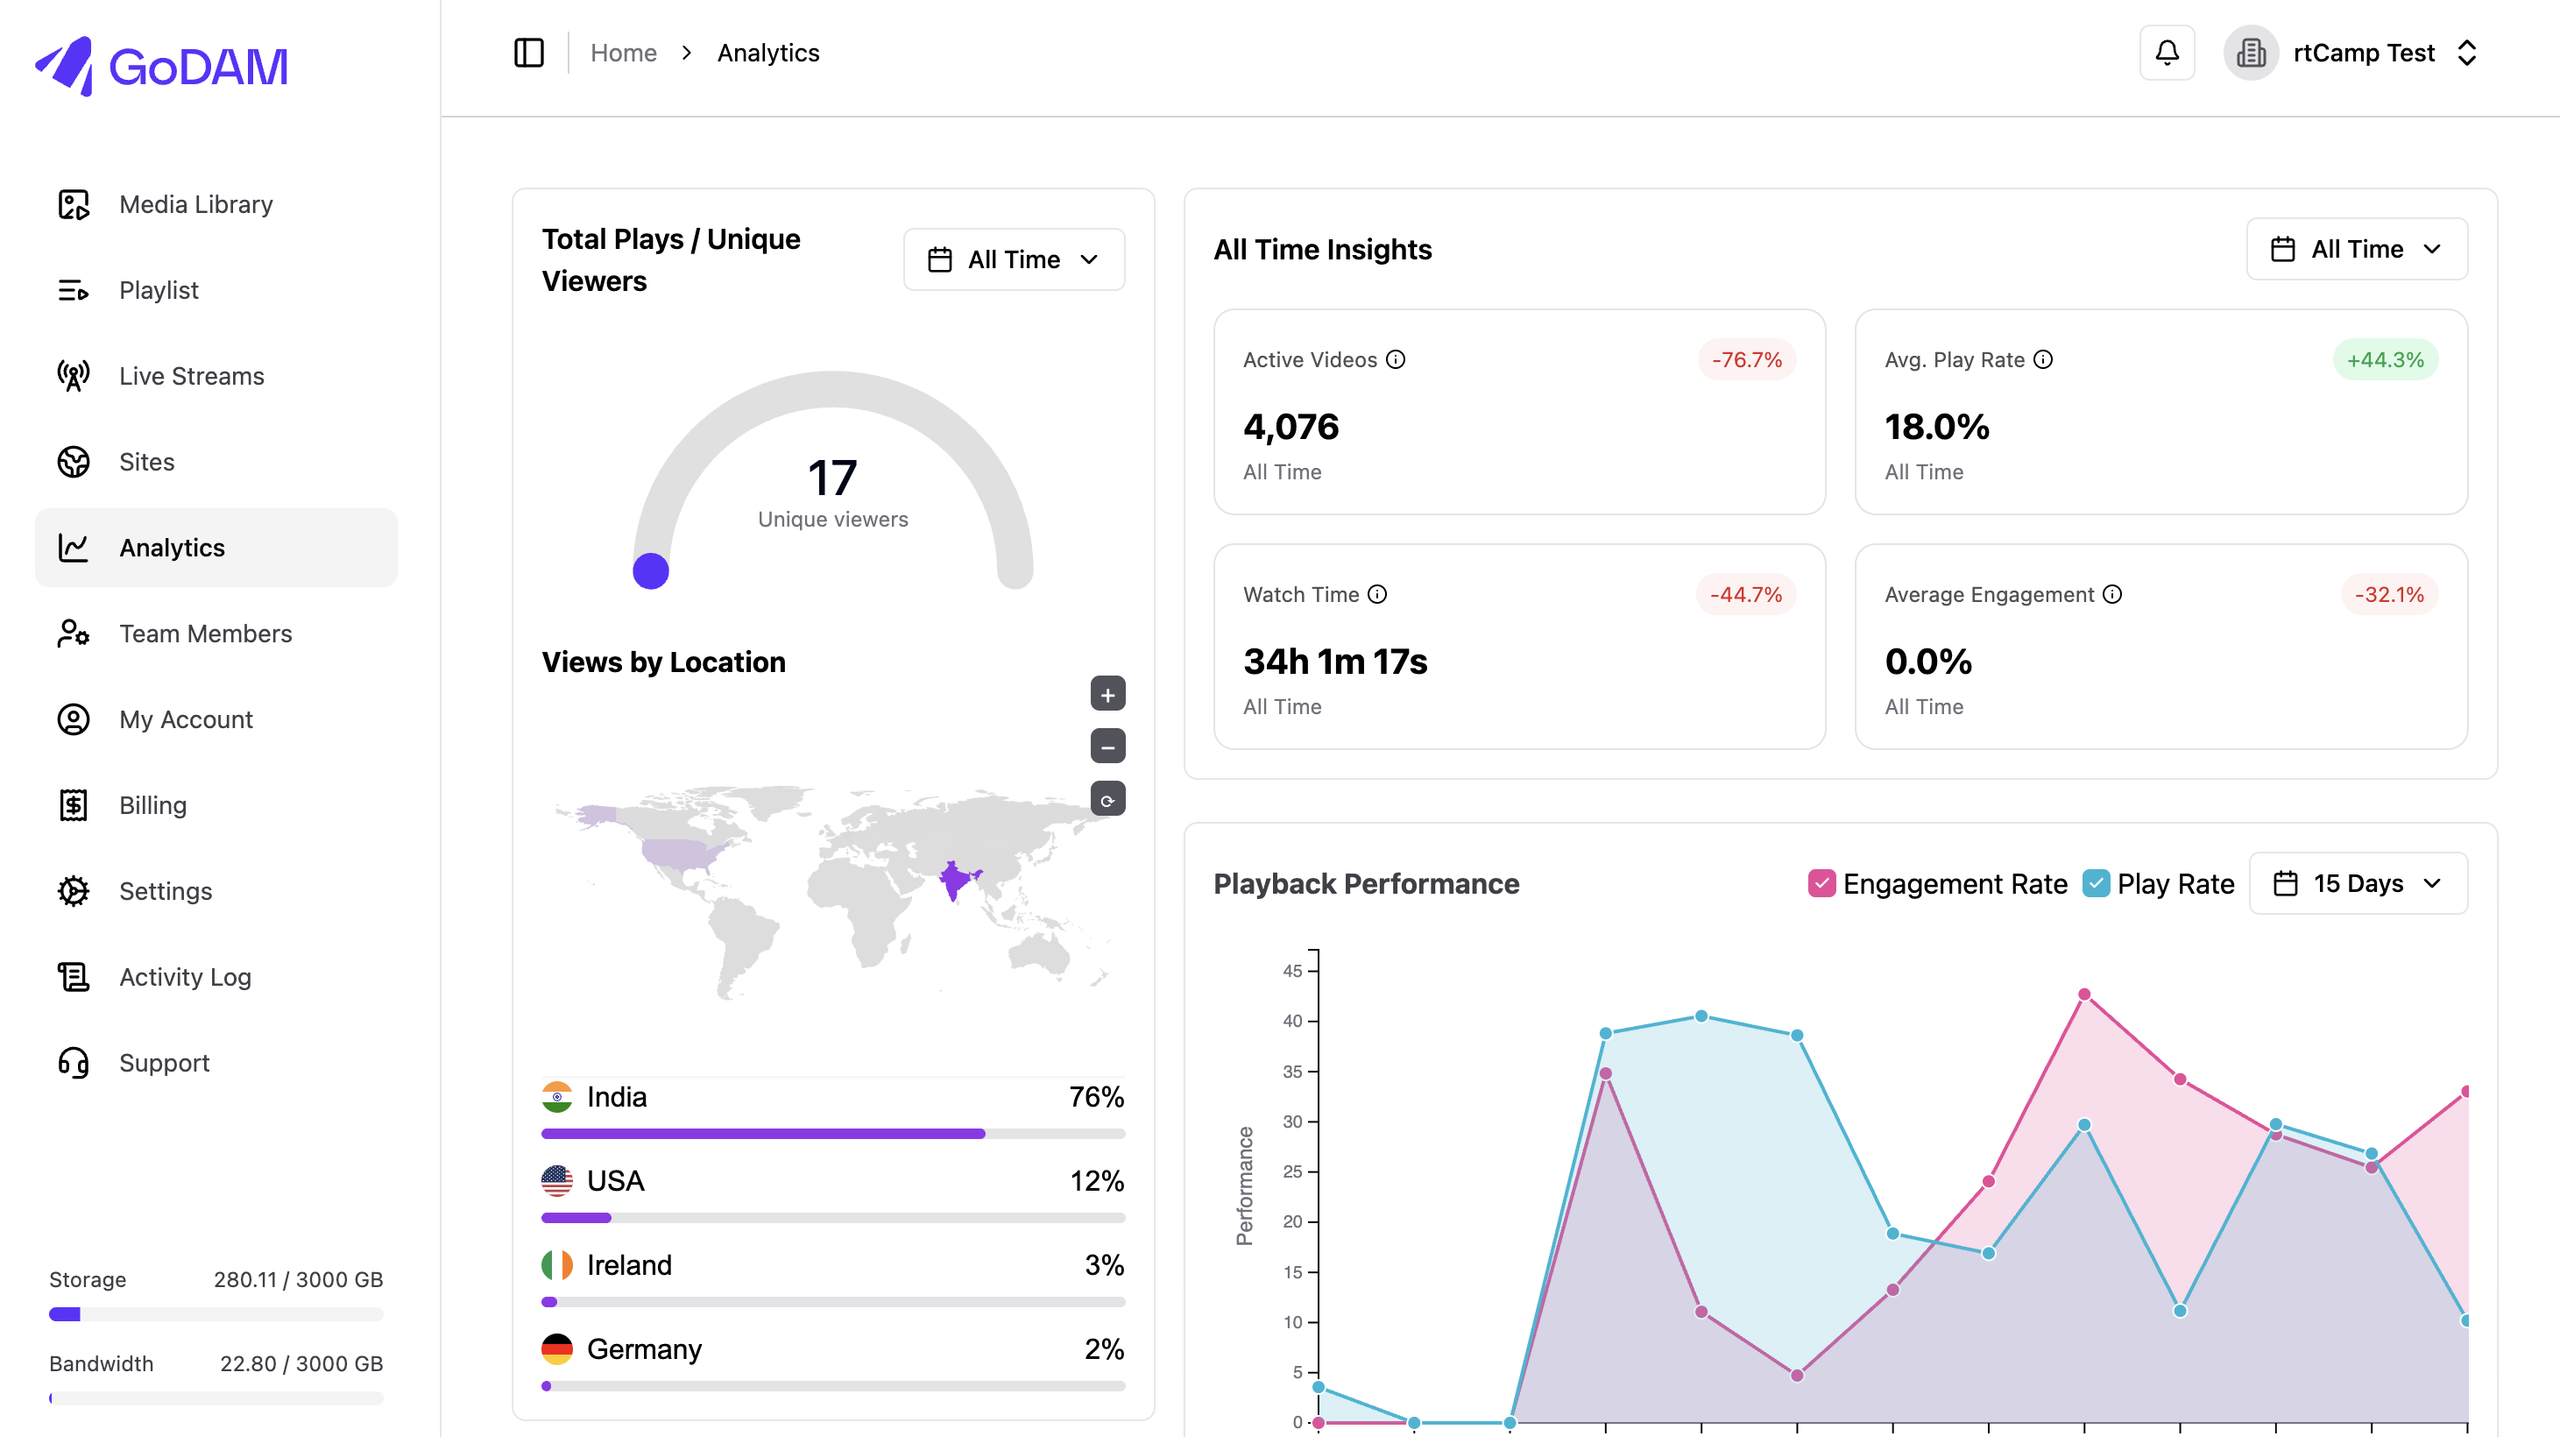
To view analytics for your whole video library:
- In the GoDAM sidebar, click Analytics.
- You’ll land on the Analytics Dashboard, showing an overview of every video in your library.
To view analytics for one specific video:
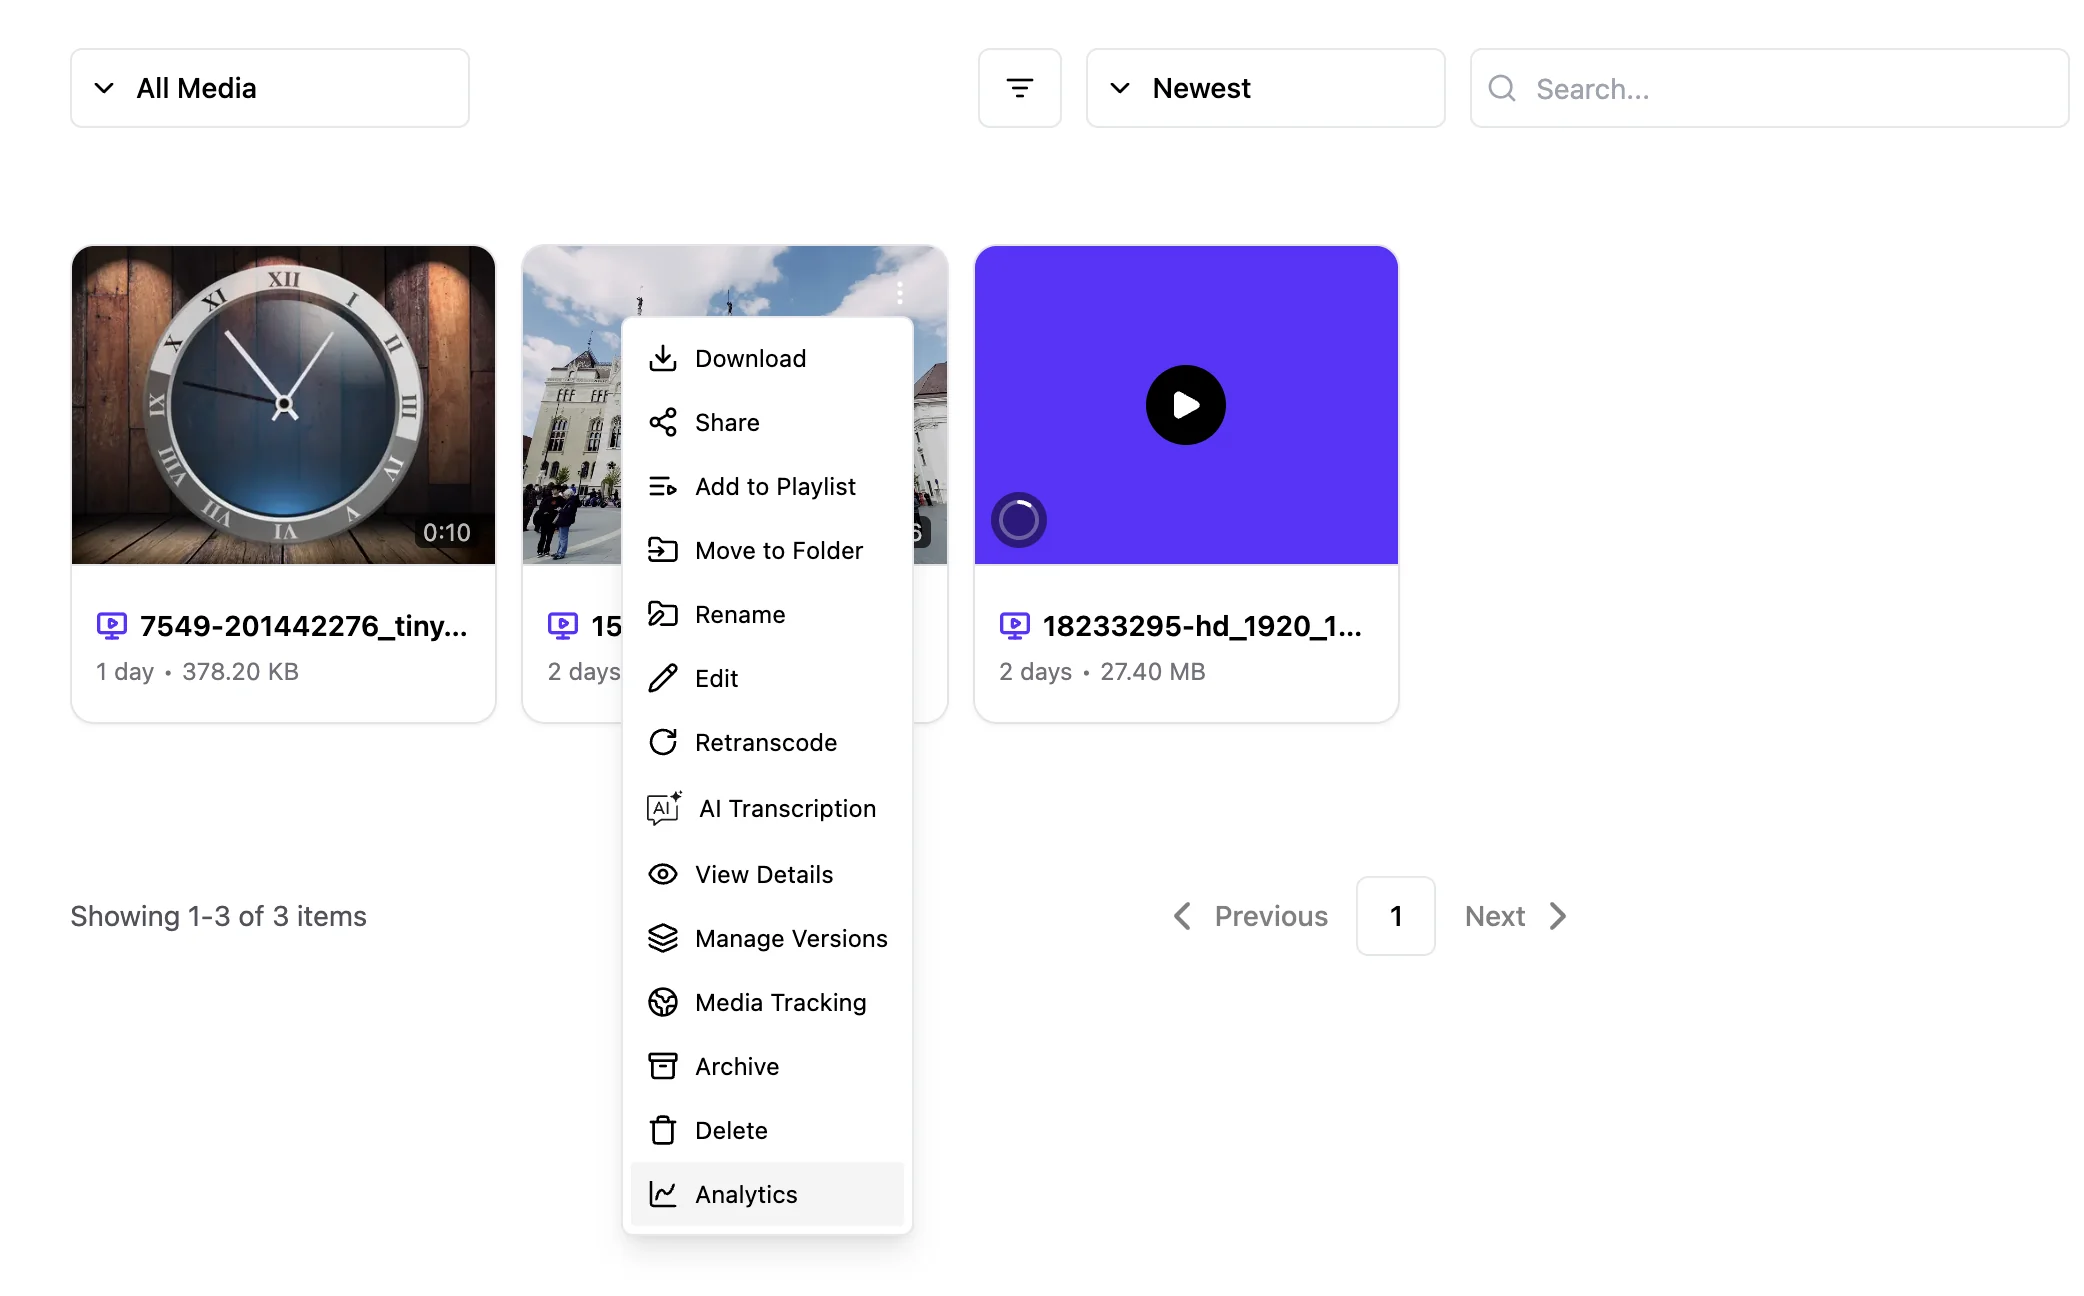
- Go to your Media Library.
- Select the video you want to analyze, and choose Analytics from its options.
- You’ll see a detailed performance breakdown for just that video.
You can also jump straight into a video’s analytics by clicking on it from the Top Performing Videos table on the Dashboard.
Note: GoDAM tracks your video everywhere people watch it, whether they play it directly through GoDAM or watch it embedded on another site (see How Embeds Are Tracked below).
The GoDAM Analytics Dashboard Gives You a Complete View of Your Video Library’s Performance
Performance Metrics
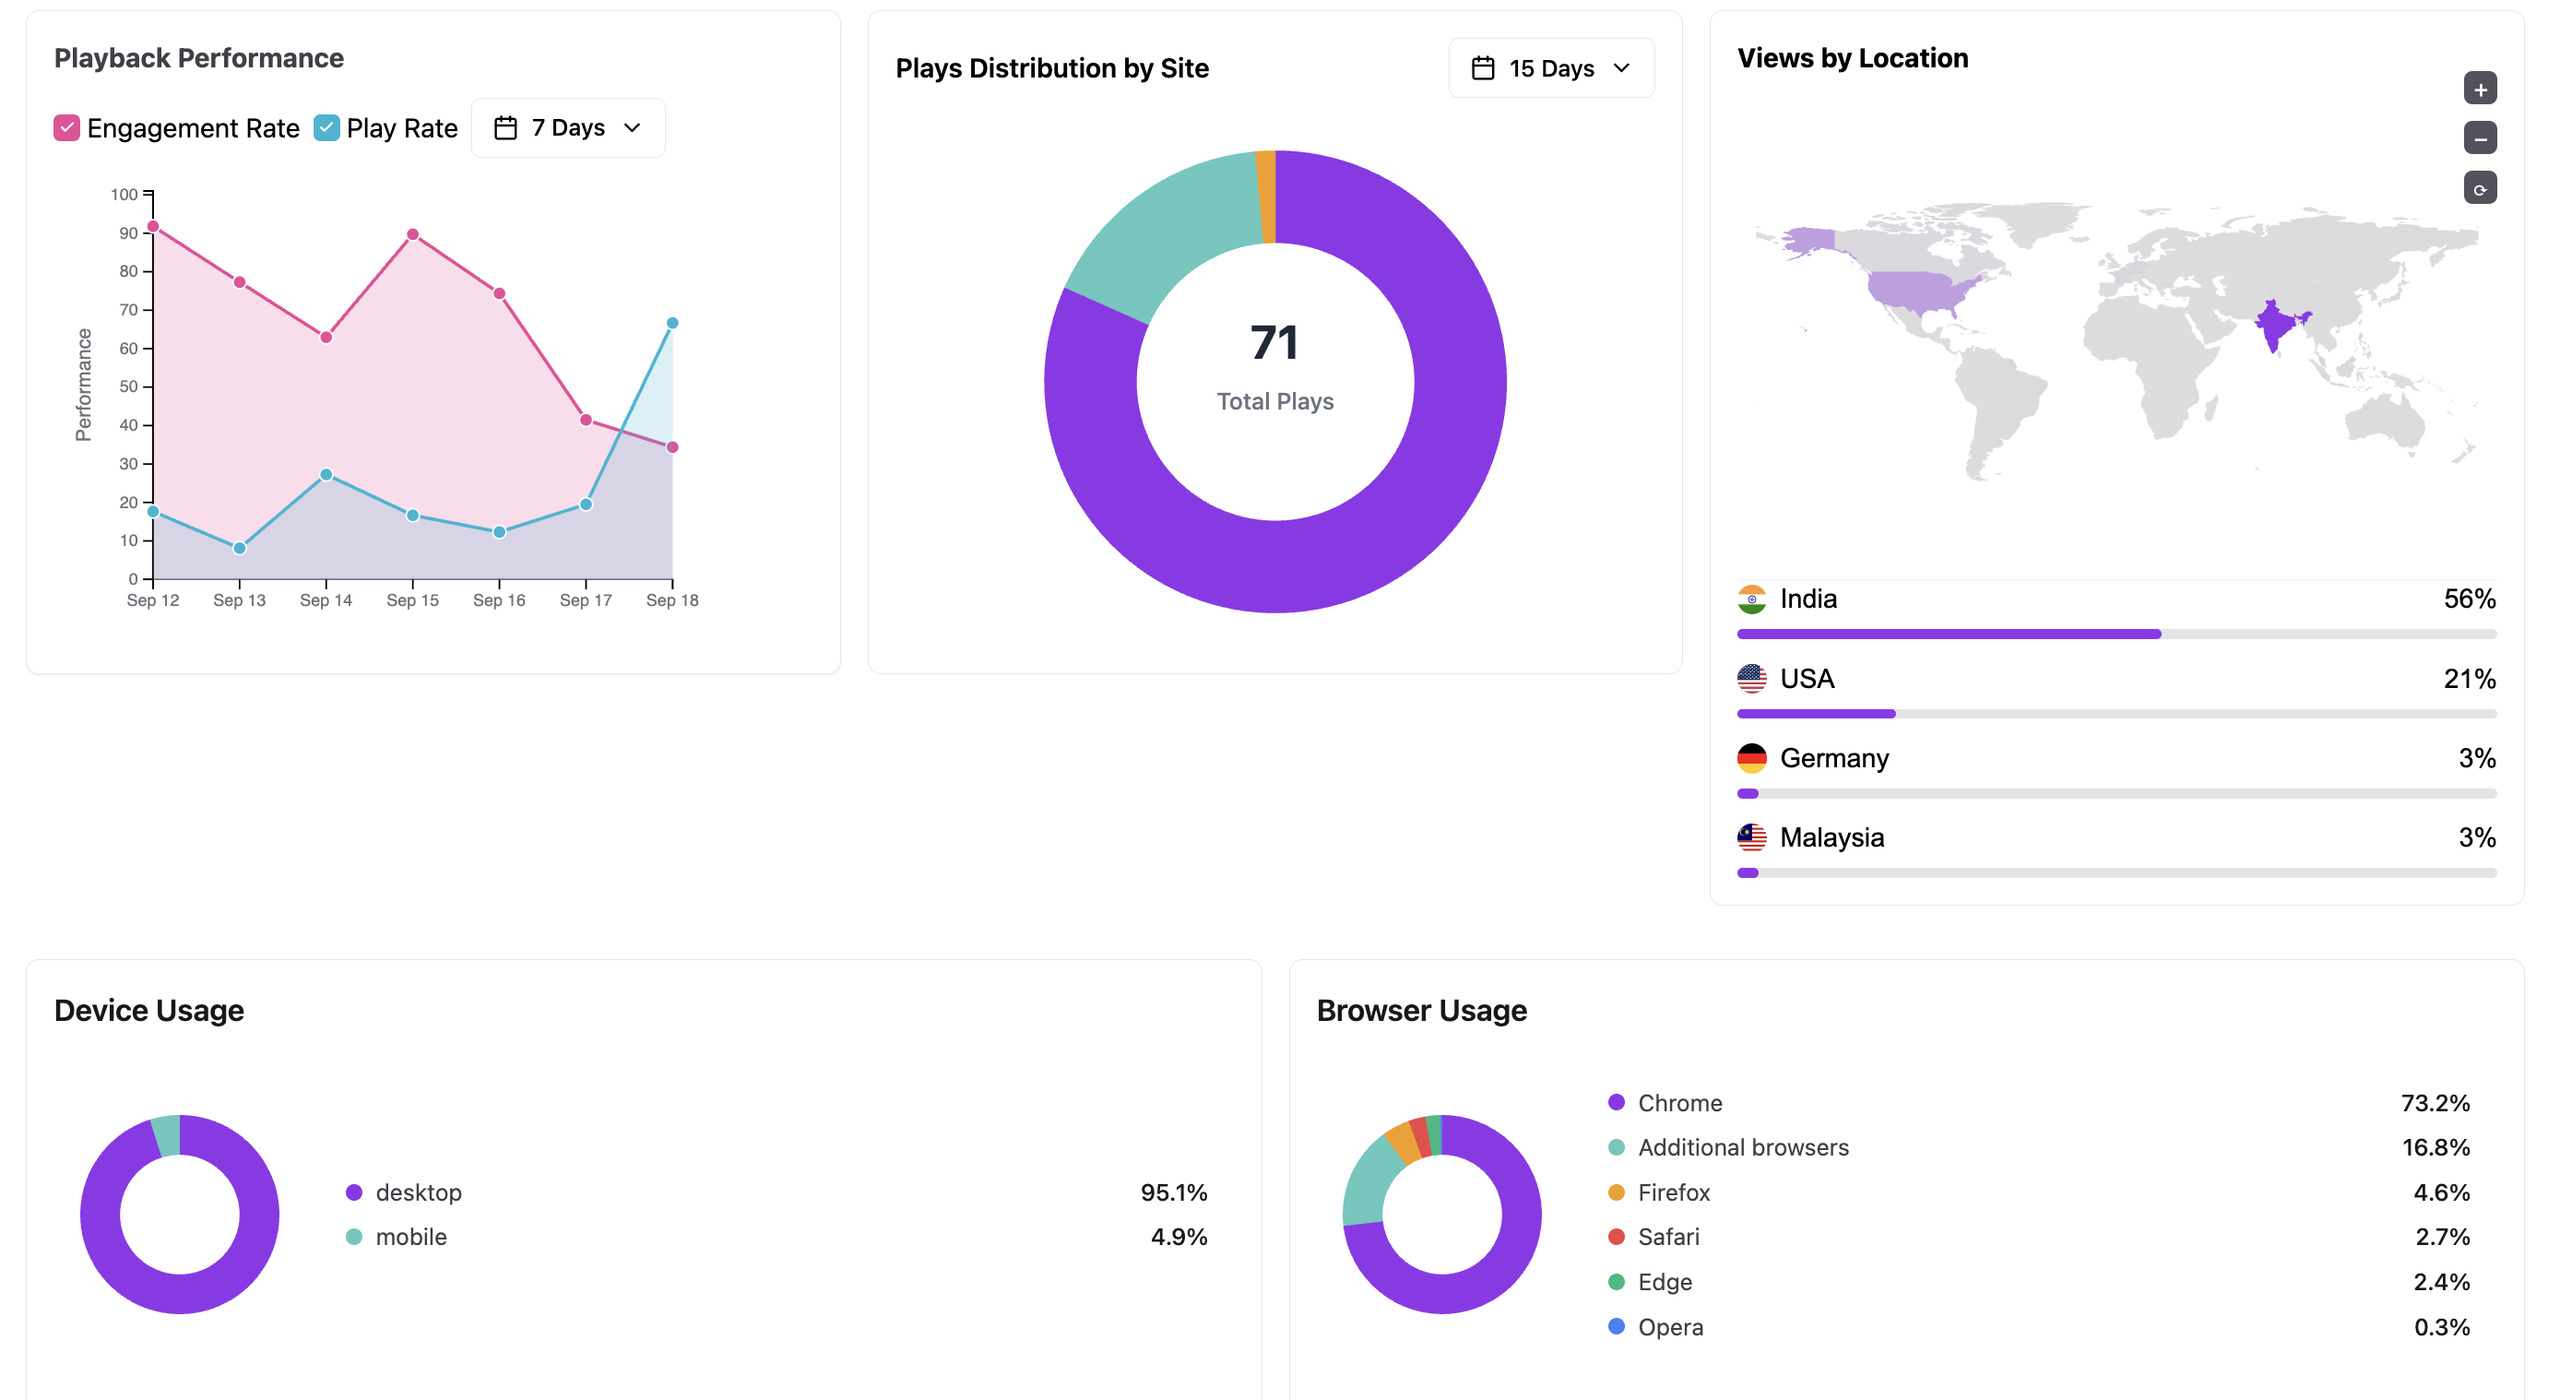
At the top of the dashboard, you’ll find your key numbers at a glance:
- Total Videos — how many videos in your library have received at least one view.
- Total Plays — the total number of times people have played your videos.
- Play Rate — the percentage of people who loaded a page with your video who actually pressed play. This tells you how compelling your thumbnail and placement are at getting people to watch.
- Watch Time — the total amount of time viewers have spent watching your videos.
Each metric card also shows a small trend chart, so you can see at a glance whether that number is moving up or down.

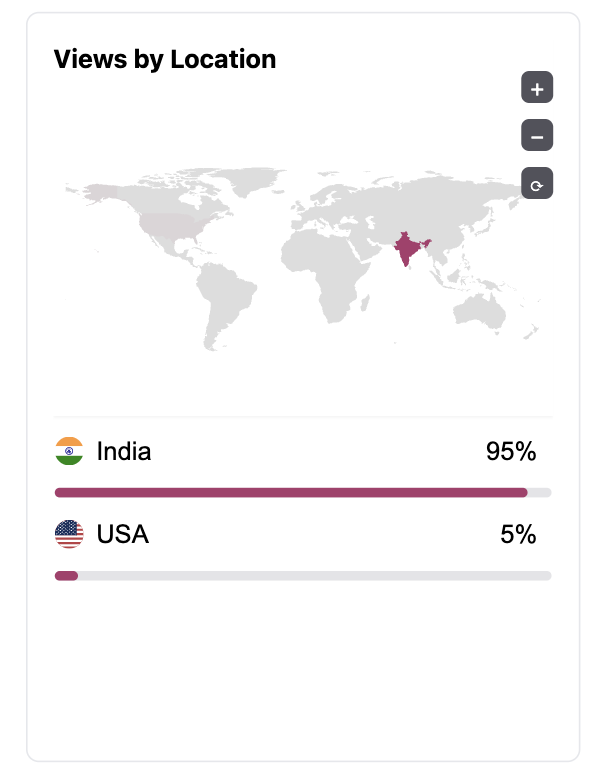
Geographic Viewer Mapping
The world map shows where your viewers are watching from. It color-codes each country by view volume: the more views from a country, the more prominent it appears on the map. Hovering over any country shows you the exact number of views from that location.
Knowing where your audience clusters helps you tailor your content, timing, and localization strategy to the regions that matter most.
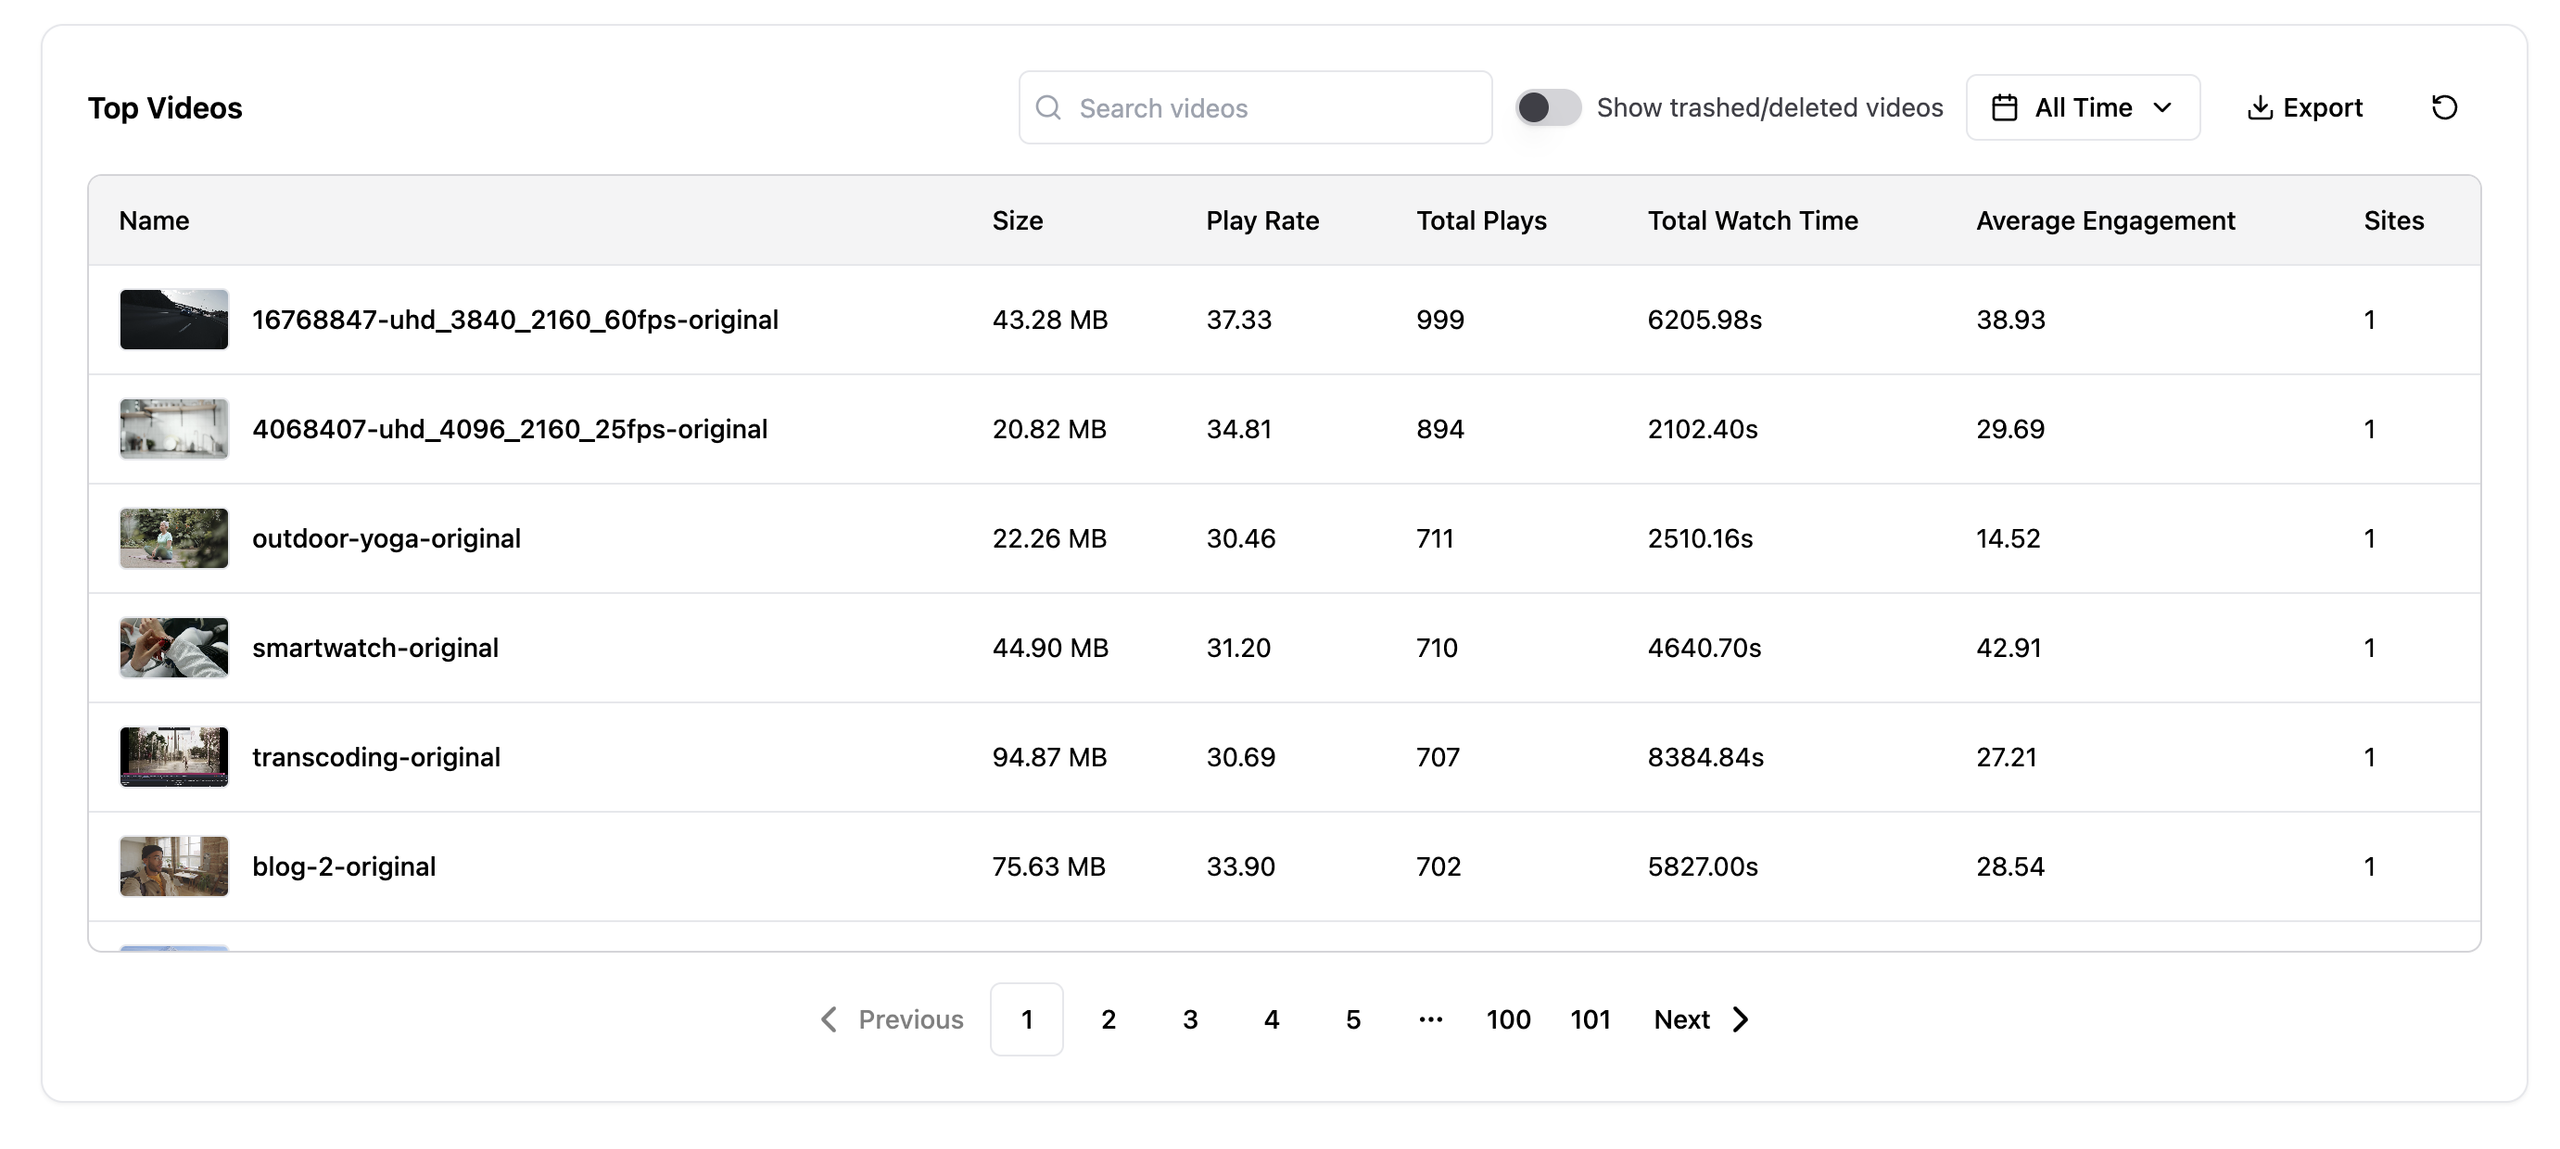
Top Performing Videos
This table ranks the videos in your library by performance, so you can quickly spot your best (and worst) content. For each video, you’ll see:
- A thumbnail and title
- Total plays, watch time, and play rate
- Sites: the number of different websites where this video has appeared so far
Click any video’s title or thumbnail to jump straight into its detailed single-video analytics.
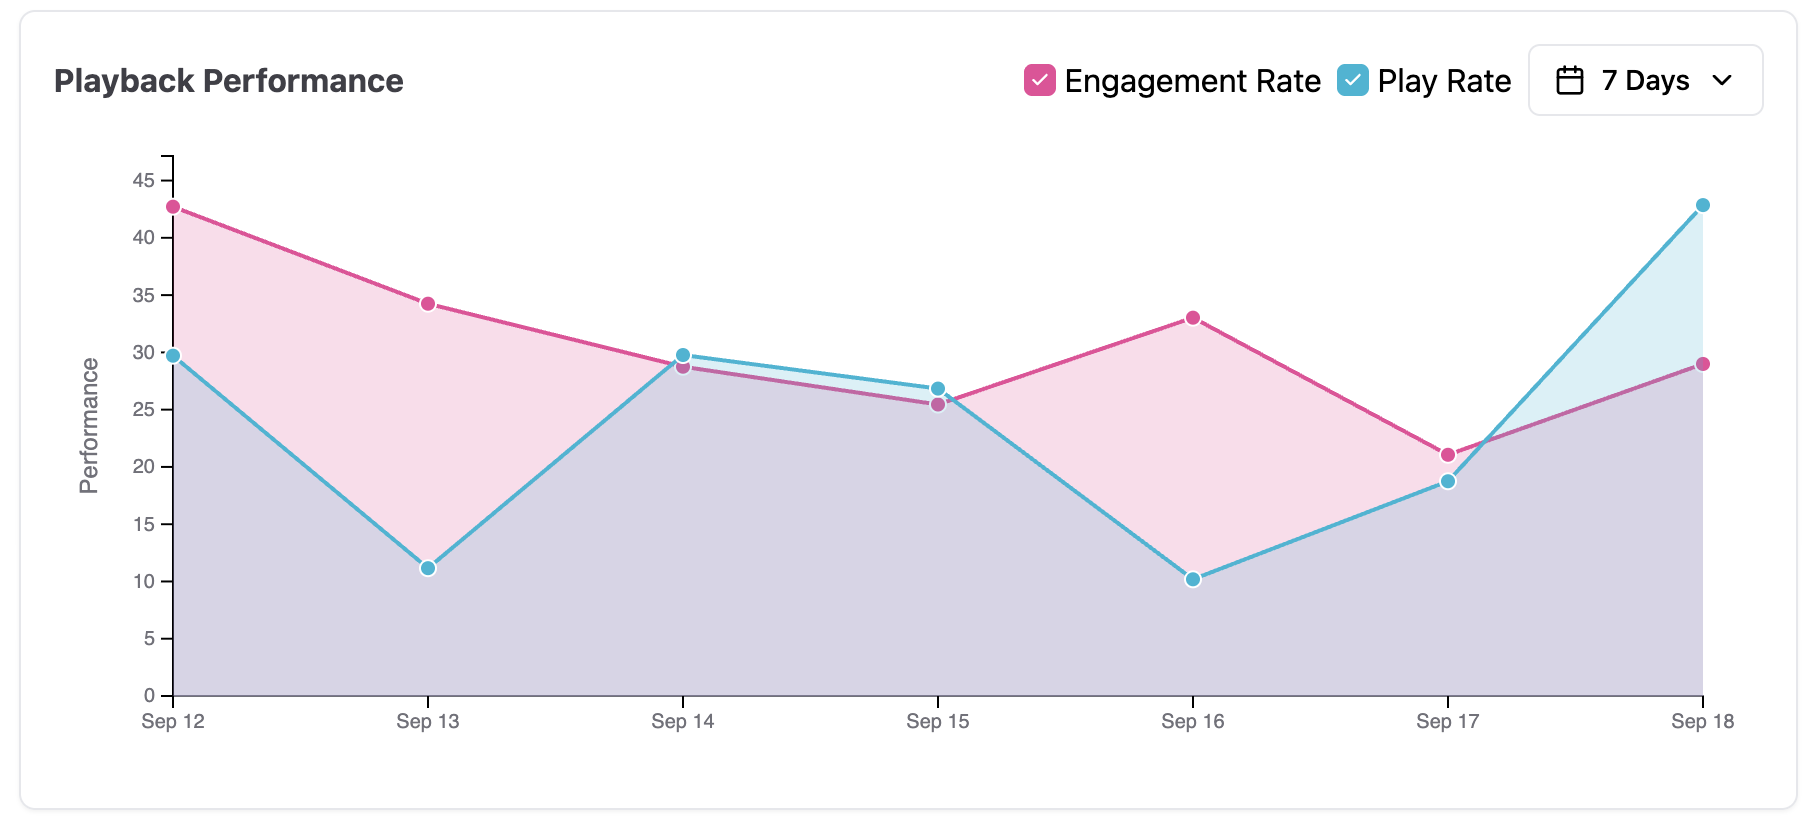
Playback Performance
This chart tracks your Engagement Rate and Play Rate over time, so you can see how your video performance trends day by day. Use the time-range selector (Last 7 Days, Last Month, Last 6 Months, Last Year, or All Time) to zoom in on a specific period — this is especially useful for spotting the impact of a recent change, like a new thumbnail or a promotional push.
Single Video Analytics — A Closer Look at One Video
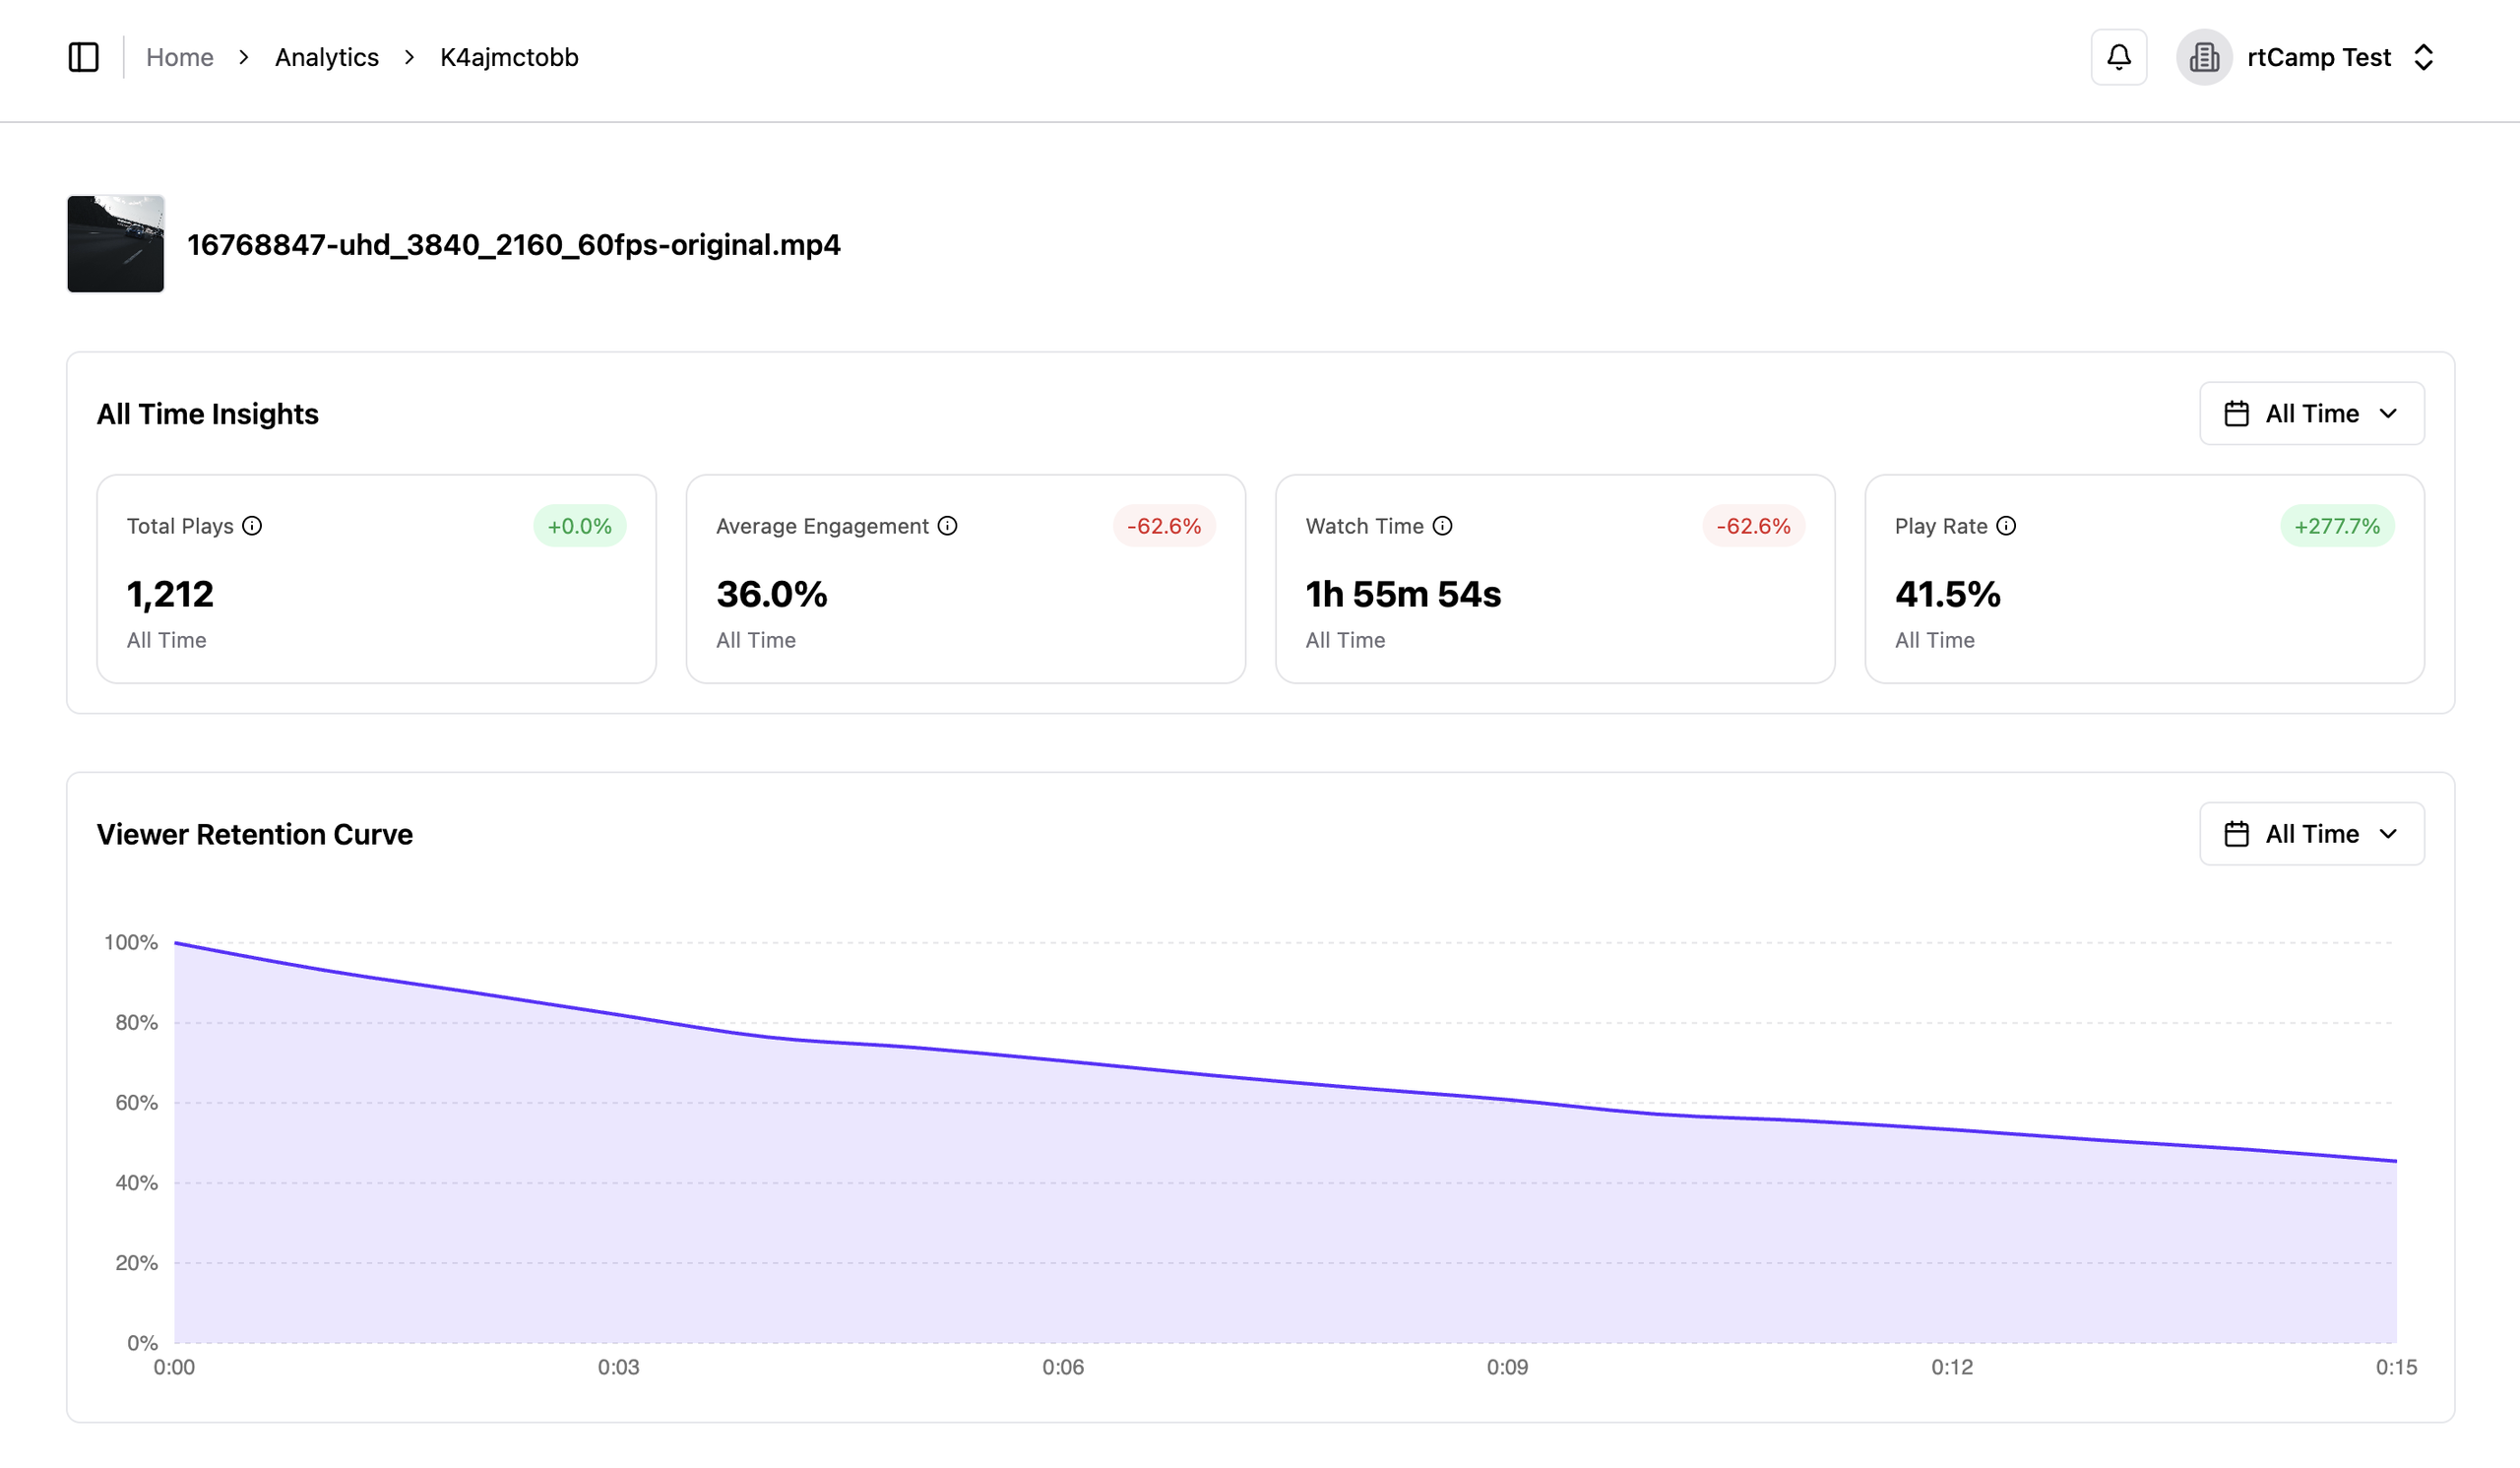
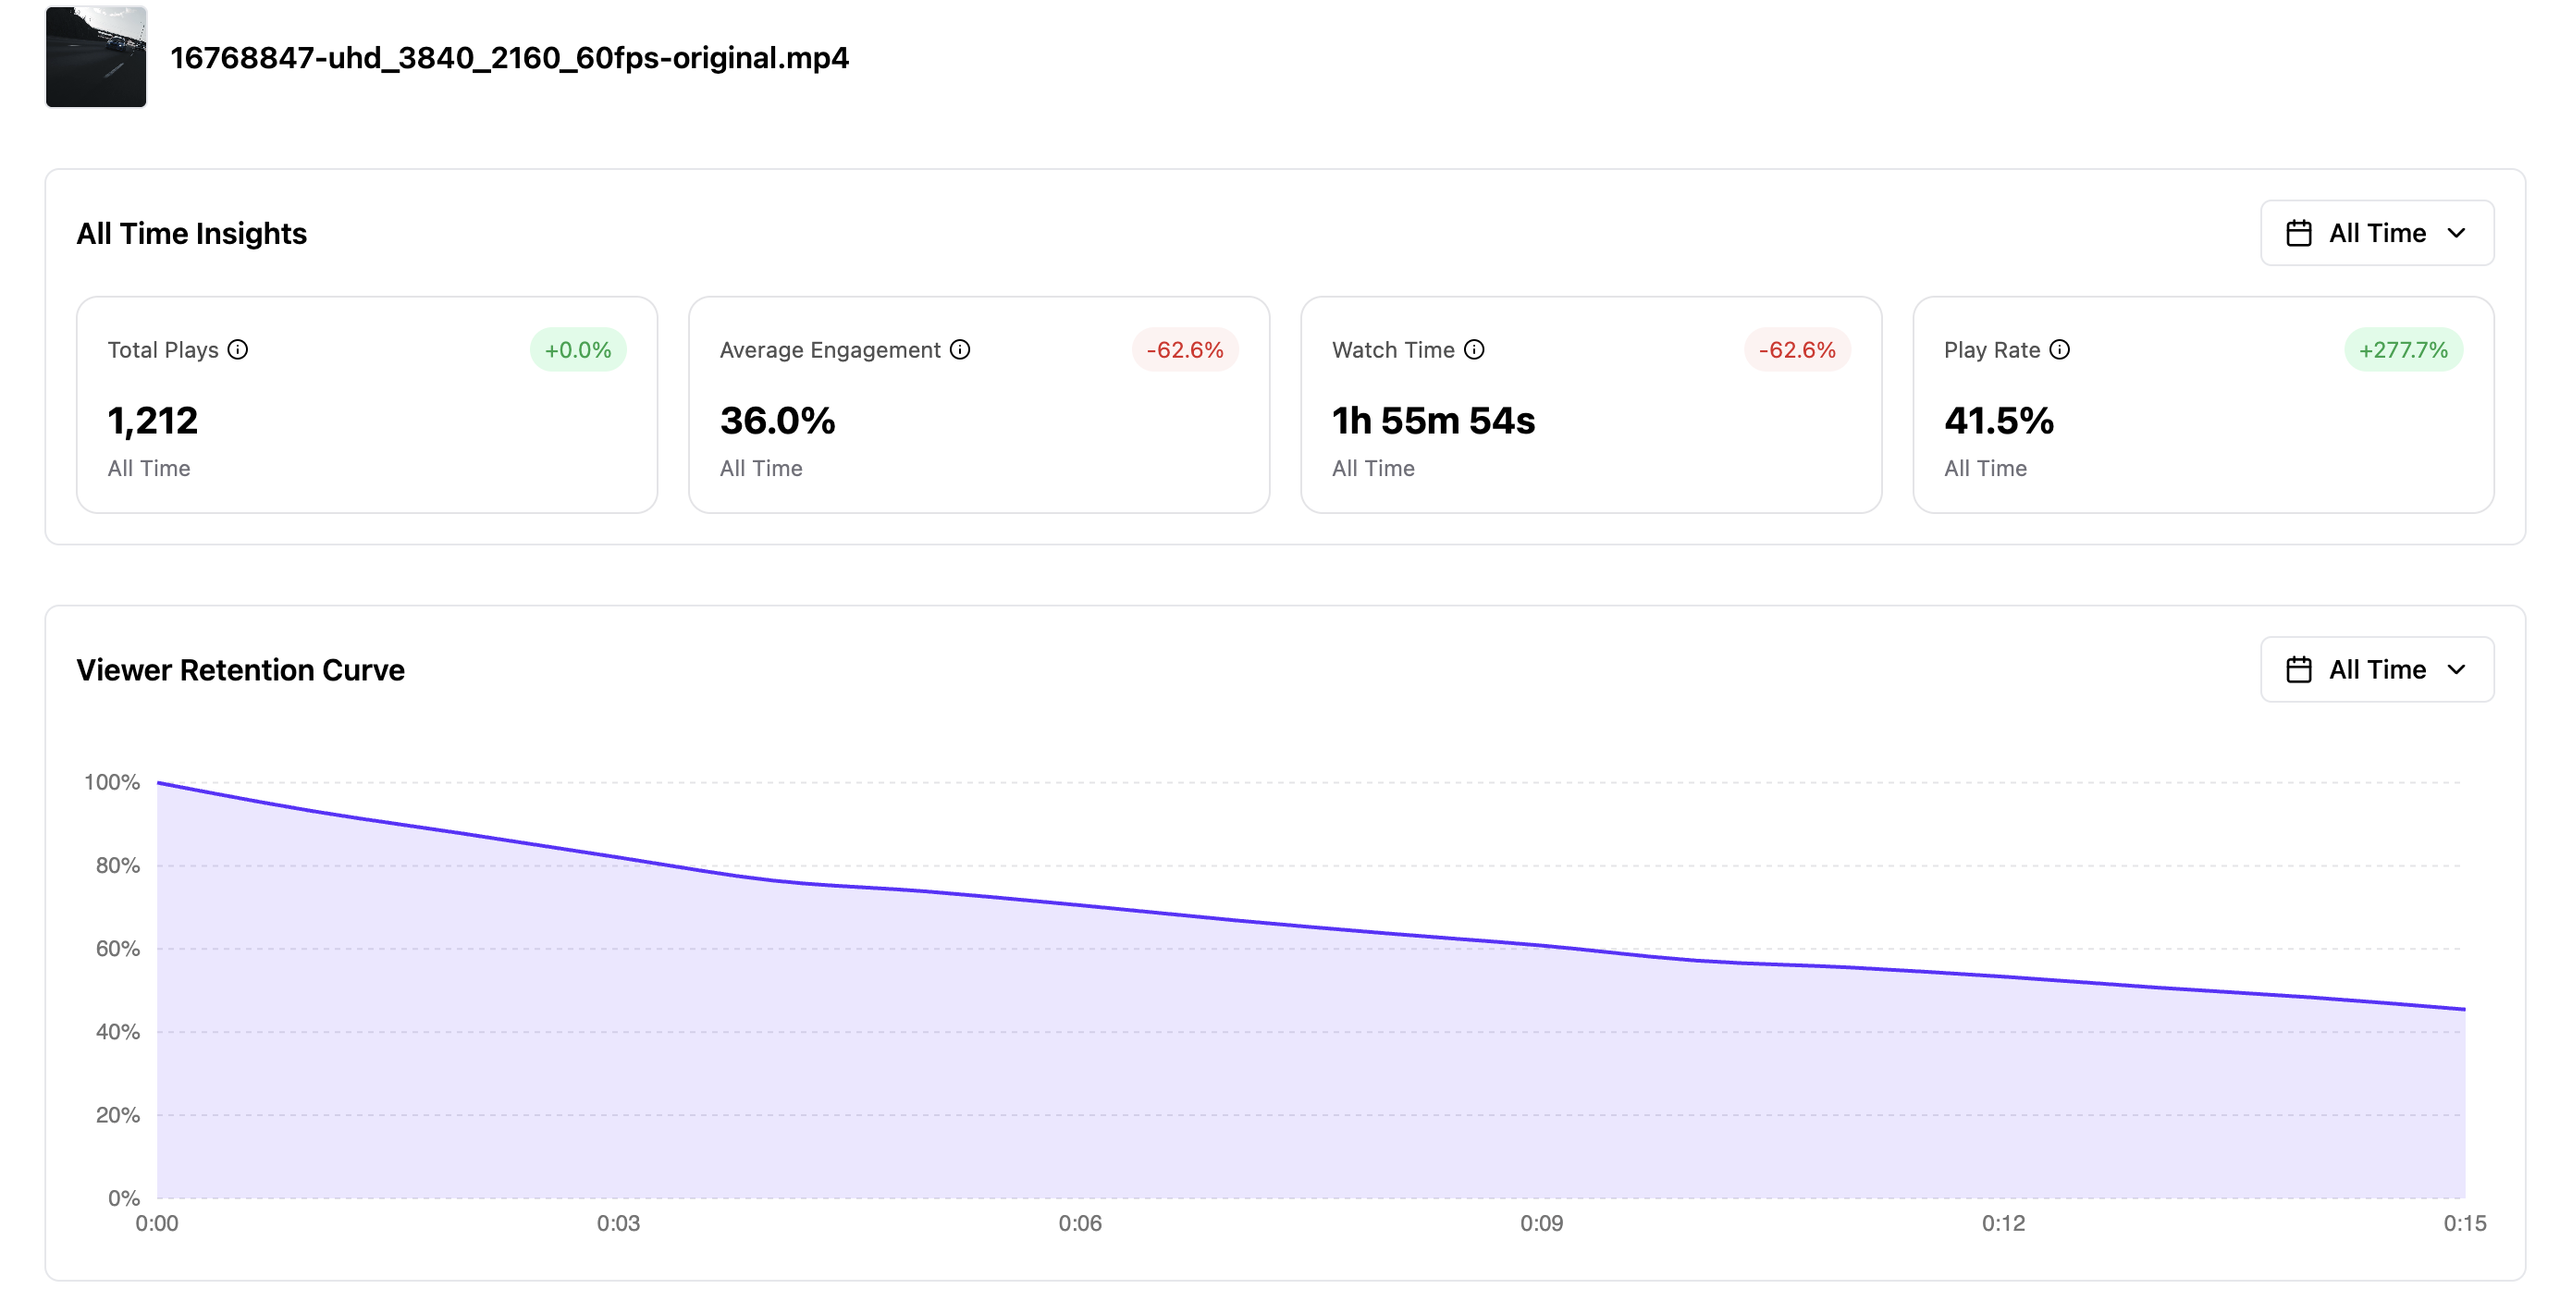
Once you’re viewing analytics for a specific video, you get several tools for understanding exactly how it’s performing.
Viewer Retention Curve
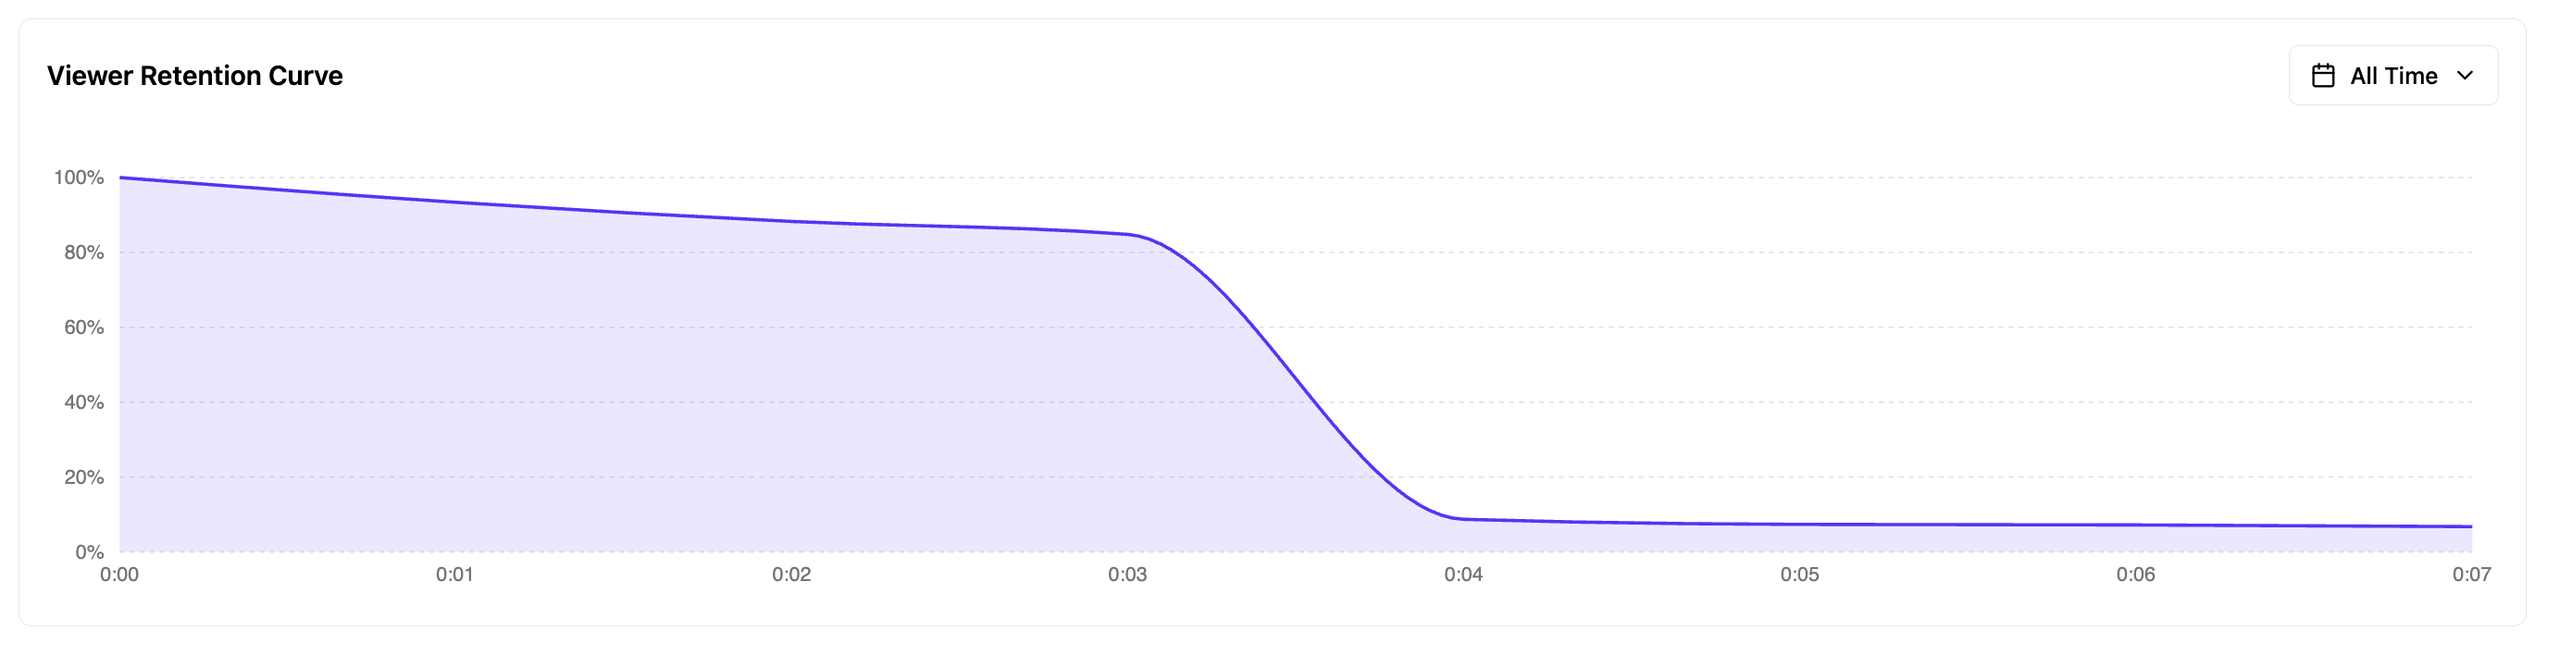
This chart shows what percentage of your peak audience is still watching at each moment in your video, so you can see exactly where viewers drop off. Hover over (or drag across) the timeline to see the percentage and the actual viewer count at that second. The video preview scrubs along with you as you go.
This is one of the most useful tools for improving future videos. If you see a sharp drop at a specific moment, that’s a strong signal something needs attention right there.
Note: The 100% mark represents your video’s single busiest moment, not necessarily the very start. If a lot of viewers join partway through (for example, from a link that jumps straight to a specific timestamp), that moment becomes your peak instead of 0:00.
Device and Browser Usage
Device Usage shows the split between Desktop, Mobile, and Unknown, for the rare view GoDAM couldn’t detect a device for. Knowing your audience’s device mix helps you decide things like whether a mobile-friendly thumbnail matters more for this particular video.
Browser Usage breaks down which browsers your viewers used, like Chrome, Safari, Firefox, and Edge, with less common browsers grouped into an Additional browsers slice. This can help you spot playback issues tied to a specific browser.

Compare Videos
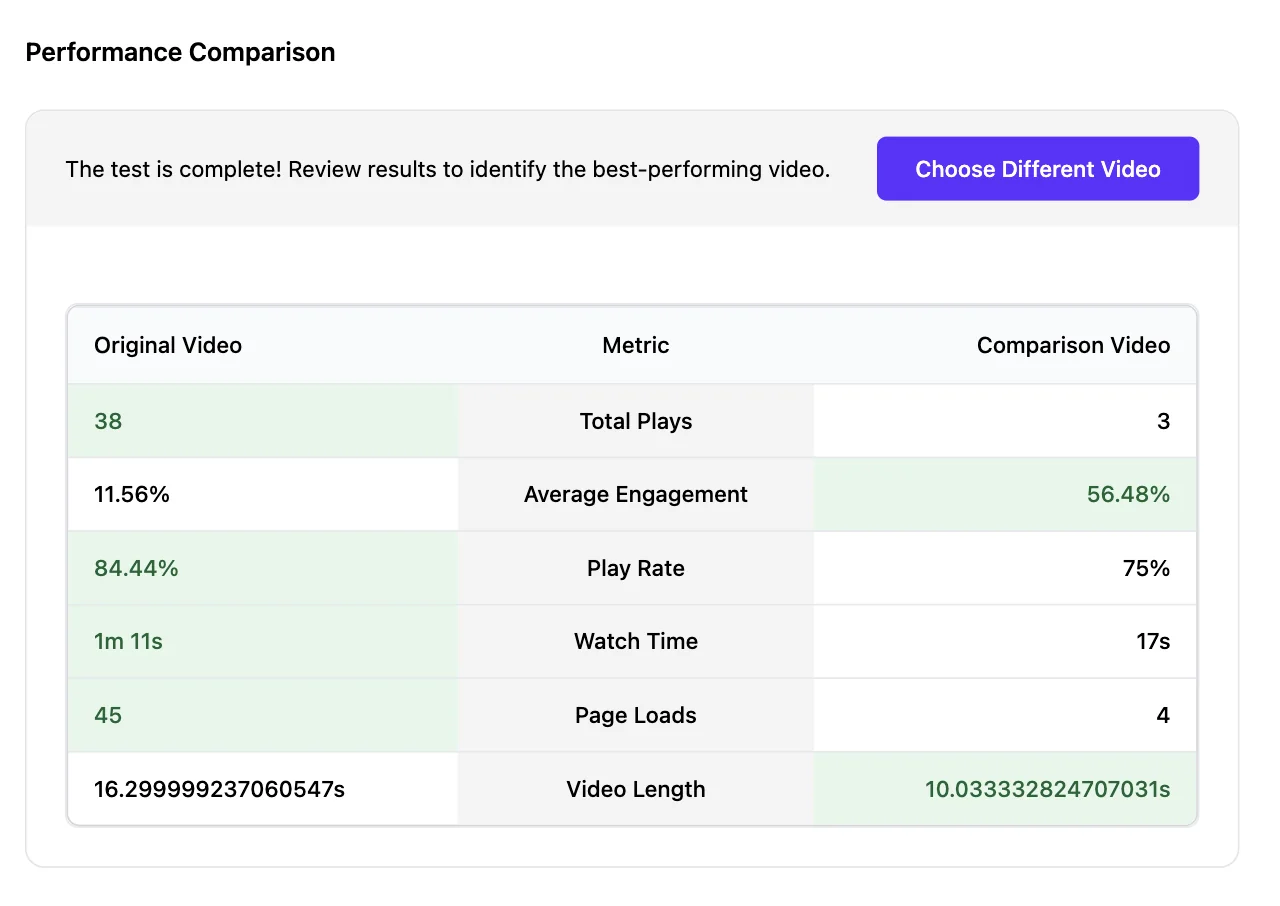
Want to know if your latest video is performing better or worse than a previous one? Use the Compare option to select another video from your library, then see both videos’ performance side by side.
Views by Site
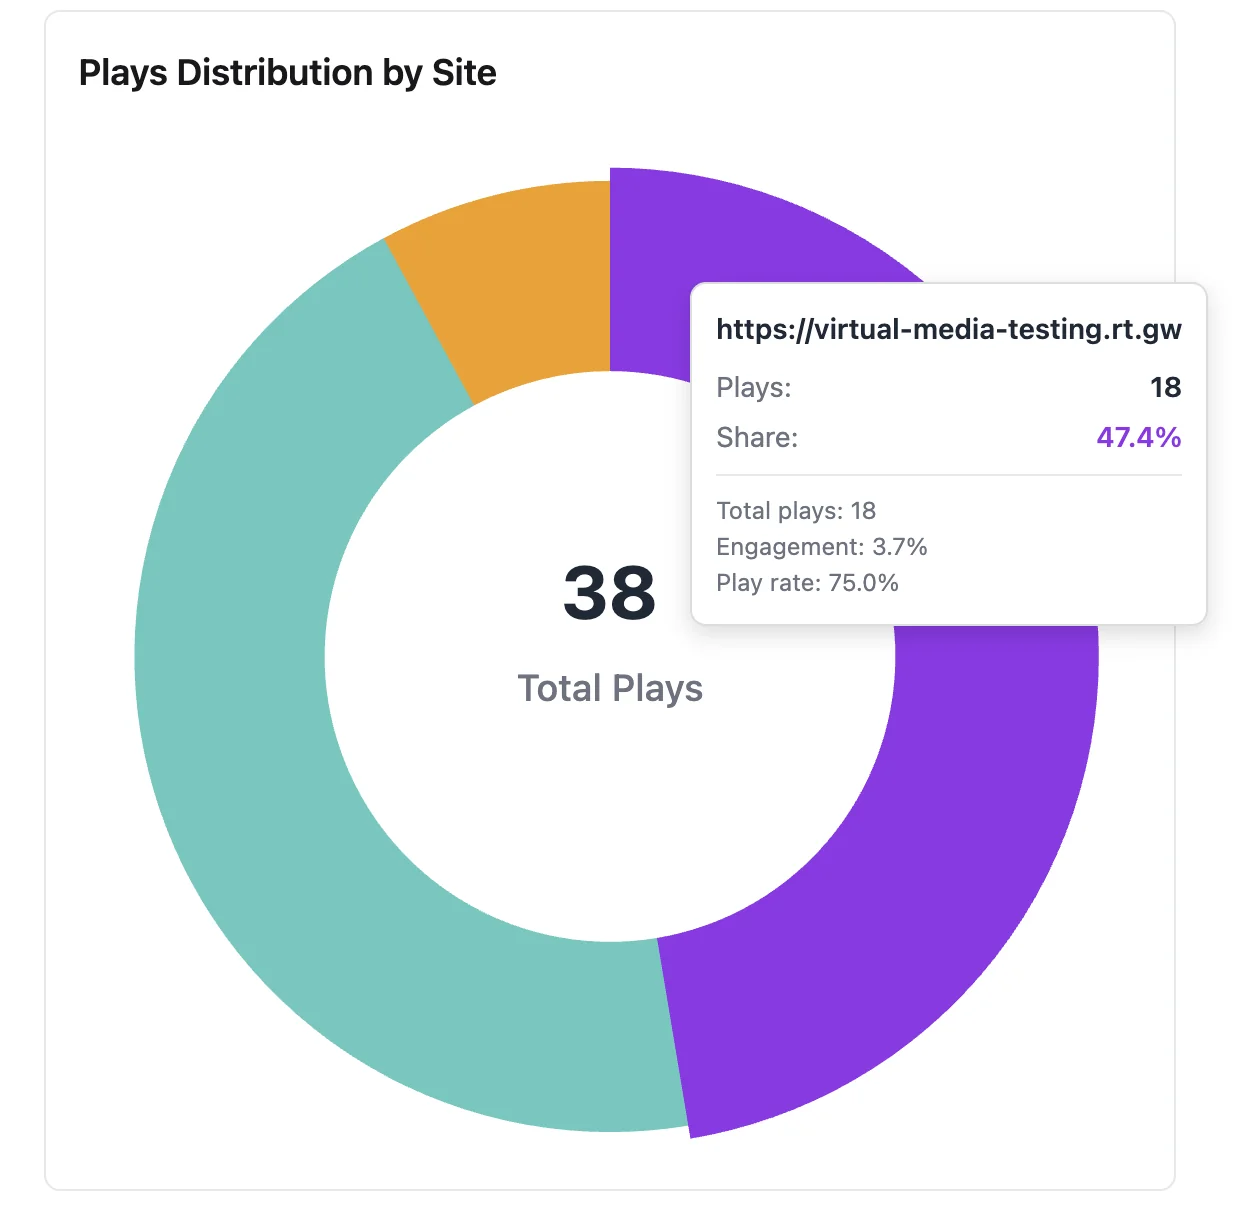
If you embed your video on multiple websites, this chart breaks down how many plays came from each site. That way you can see where people are actually watching your video, not just where you originally uploaded it.
How Embeds Are Tracked
When you embed a GoDAM video on another website, that embed is still just your video. Every play, watch-time second, and viewer location it collects rolls straight back into this same dashboard and into that video’s own analytics.
For example, say you upload a product demo video to GoDAM and embed it on your blog and on your online store’s product page. When someone watches it on your blog, that view adds to the product demo’s Total Plays and its retention heatmap, and the blog’s domain shows up as one entry in Views by Site. When someone watches it on the store page instead, GoDAM tracks that view the same way and credits it to the store’s domain. Add up both entries in Views by Site and you get the same Total Plays shown at the top of the video’s analytics. Every embed feeds one unified picture of how that video performs, no matter where people actually watch it.
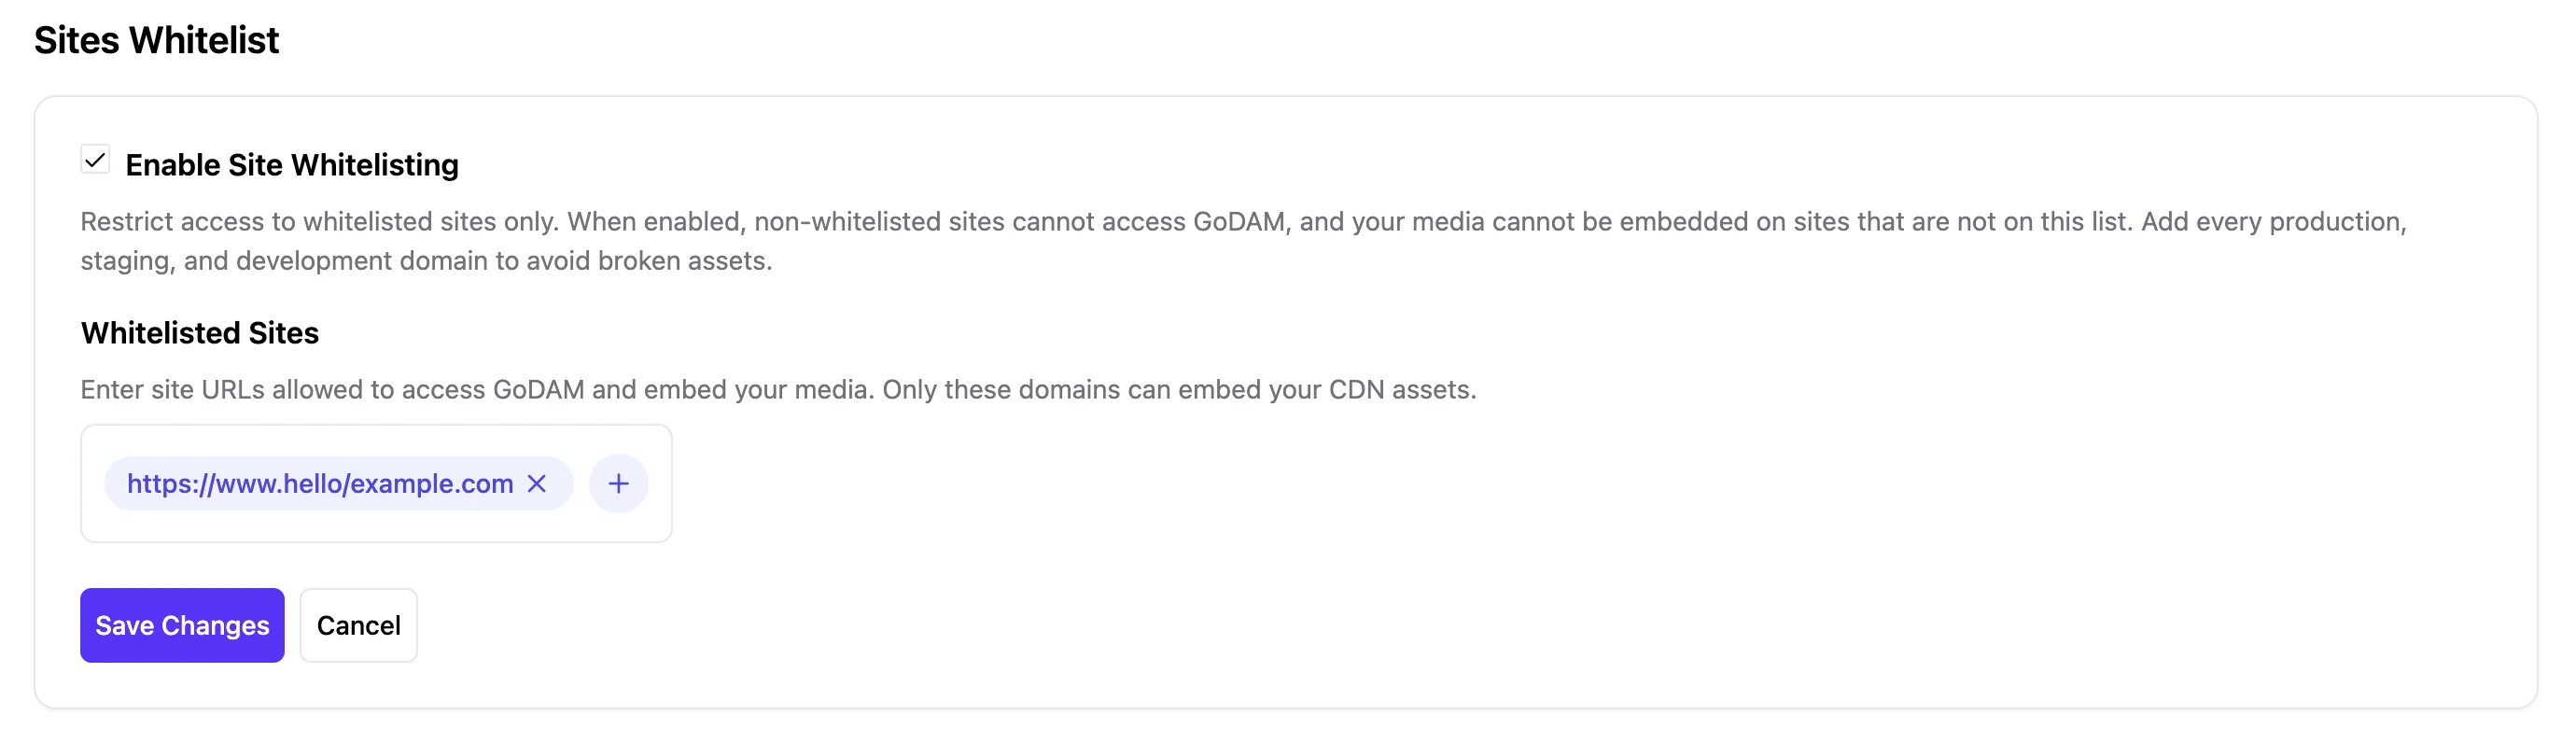
Important: If you’ve turned on Site Whitelisting (under Sites in the sidebar), an embed only tracks views from domains on your Whitelisted Sites list. Add every domain you embed your videos on to that list first, or those embeds won’t play at all on unlisted domains, let alone show up in your analytics.
Have questions about your video analytics? Reach out to our support team, and we’ll be happy to help.