How to Use Video Analytics to Refine Your WordPress Content Strategy
In today’s digital world, video is king. From blog posts to product pages, videos grab attention, keep users engaged, and drive conversions, this is why 86% of marketers say that video content has helped drive more website traffic. But here’s the truth: publishing videos isn’t enough. If you’re not analyzing how those videos perform, you’re leaving money (and engagement) on the table.
Why Video Analytics Matter
Most WordPress site owners rely on gut feeling or vanity metrics like “views.” But smart marketers know better. You need to understand how viewers interact with your videos:
- Are people watching the full video or dropping off early?
- Which pages drive the most video views?
- What content resonates in which regions?
- Which video thumbnails and placements actually get clicks?
That’s where GoDAM’s Video Analytics for WordPress comes in. With real-time data on plays, play rates, watch time, viewer retention, heatmaps, and geographic engagement, you can refine your strategy, double down on what works, and fix what doesn’t.
Let’s understand all metrics that GoDAM provides and how you can use them.
Top Level Summary Dashboard
Total Active Videos

This shows how many unique GoDAM videos are displayed on site and actively engaging viewers within a given period. It helps you track whether your overall content library is gaining traction or becoming stale. Use it to identify if you need to promote, update, re-edit underperforming videos or create more videos.
Action Step – If active videos are low, consider publishing more videos, embedding them on more pages, and refreshing older content. More active videos drive more plays, which leads to higher engagement and conversions.
Total Plays
Total Plays is the cumulative number of times all your videos have been viewed. It highlights overall video reach and content visibility. Use this to measure growth trends and track the impact of new campaigns.
Action Step – If plays are low, increase promotion of video-heavy pages, use stronger CTAs around video content, or feature videos in newsletters and social media.
Play Rate
Play Rate measures the percentage of visitors who clicked Play after a video loaded. It reflects the effectiveness of your thumbnail, title, and placement. Low play rate? Test stronger visuals or reposition your video on the page.
Action Step – If play rate is low, test new thumbnails, add enticing titles, or reposition videos higher on the page for more visibility.
Watch Time
Watch Time shows the total duration viewers spend watching your videos collectively. It signals overall viewer interest and retention levels. Use this to measure whether long-form or short-form content keeps audiences engaged.
Action Step – If watch time is low, shorten videos, refine intros, or add storytelling to maintain interest. For long-form videos, break them into series for better retention.
Playback Performance
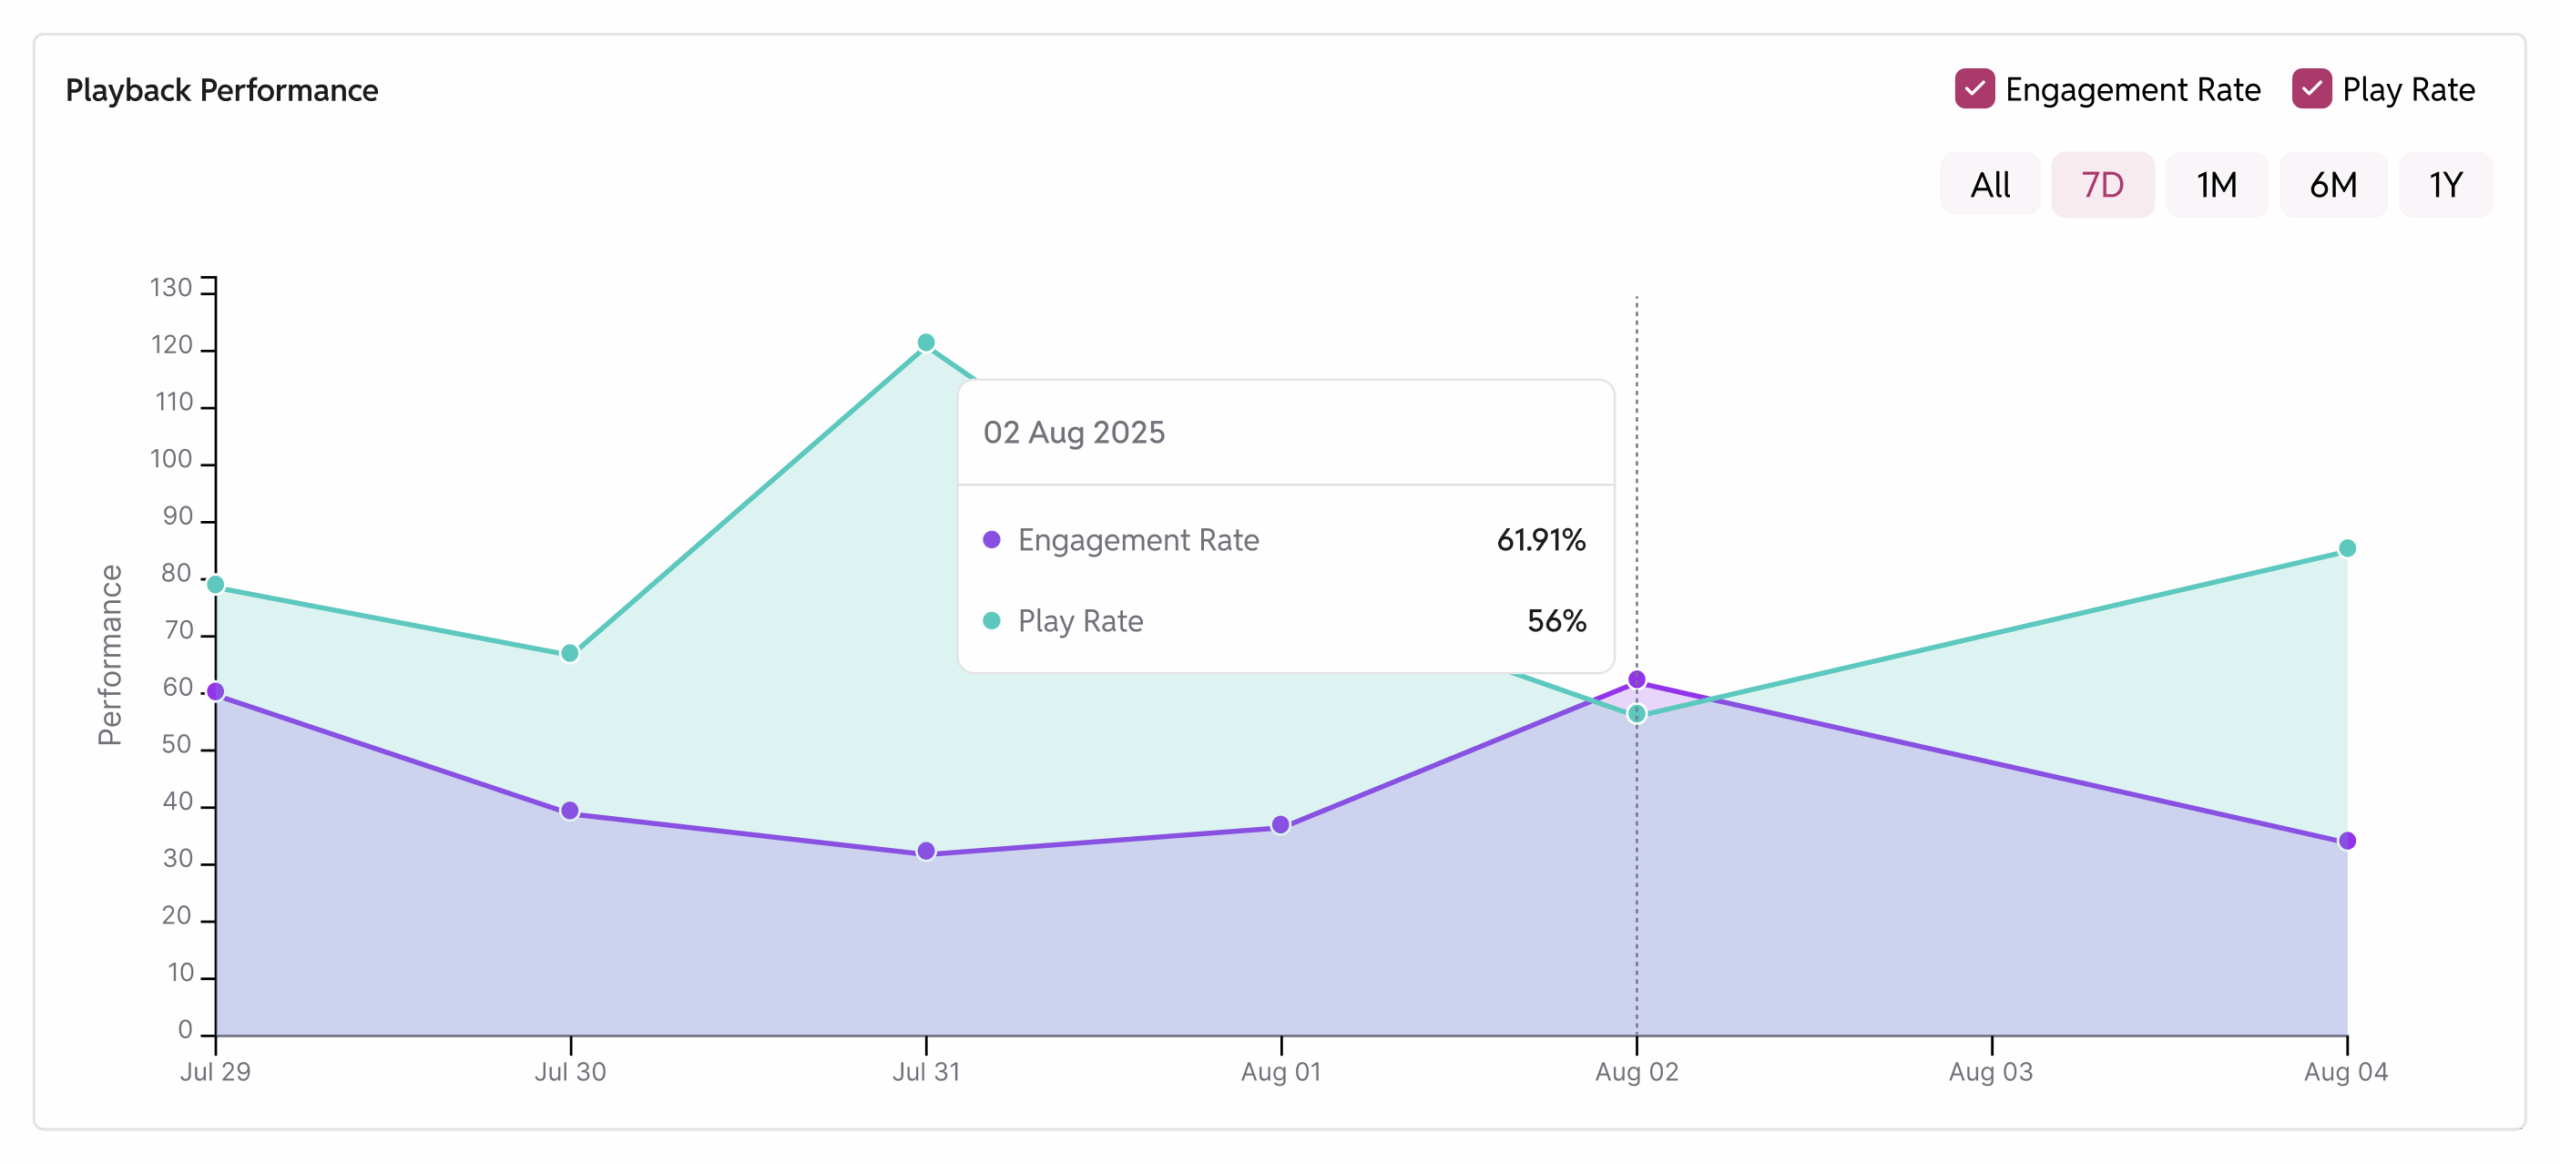
Playback Performance tracks how Play Rate and Engagement change over time. It highlights trends and shows if recent edits or optimizations worked. Use it to validate experiments like new thumbnails or updated scripts.
Action Step – If performance is dropping, review recent changes or newly added content formats. Use trend comparisons (last 7 days vs last month) to see what’s working.
Views by Location
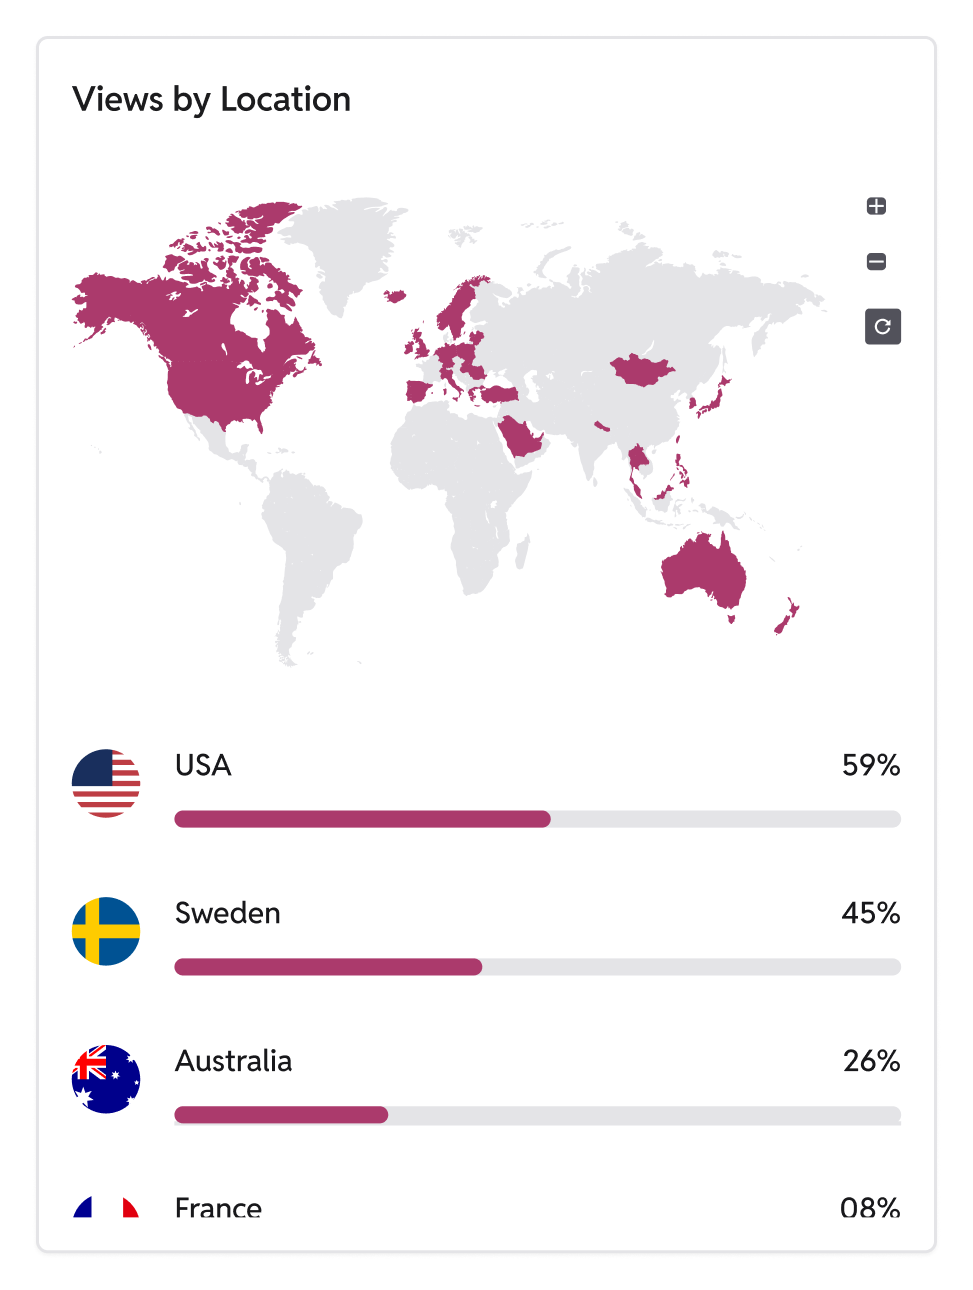
This maps where your viewers are watching from country. It’s essential for tailoring campaigns and posting schedules to match regional interest. Use it to guide localization and maximize impact globally.
Action Step – If some regions underperform, localize content, adjust publishing times, or run region-specific campaigns to maximize relevance.
Top Videos
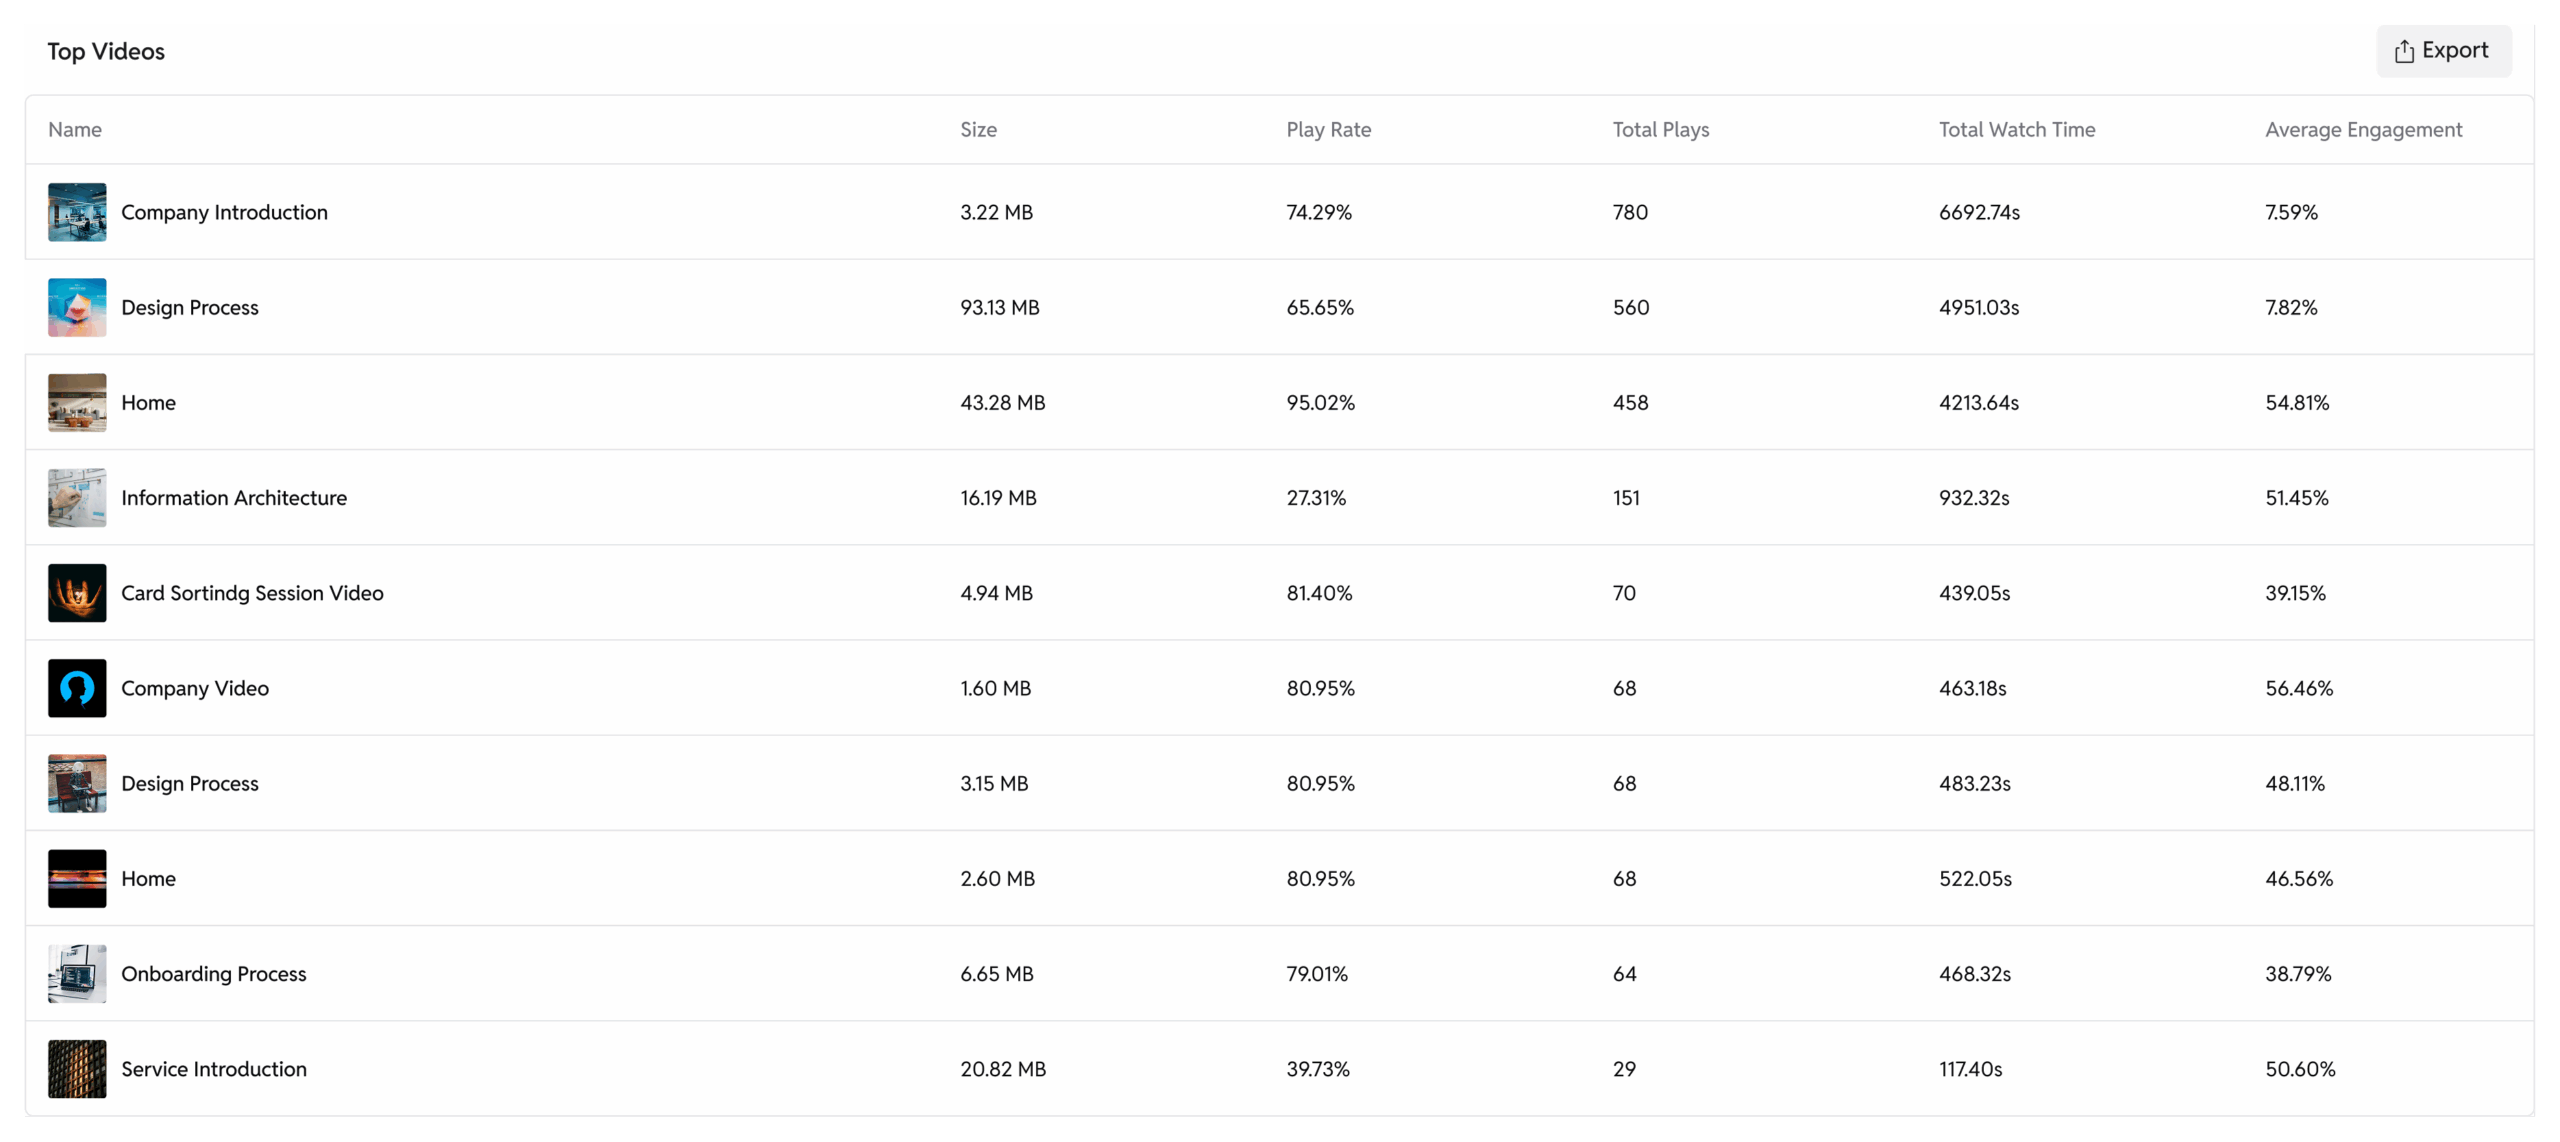
Top Videos automatically ranks your best performers based on engagement and interaction. It helps you identify what resonates most with your audience. Use this insight to replicate winning content formats and scale success.
Action Step – Repurpose or promote top videos further, and model new content on their style. Retire or re-edit videos at the bottom of the rankings.
Single Video Analytics
Average Engagement
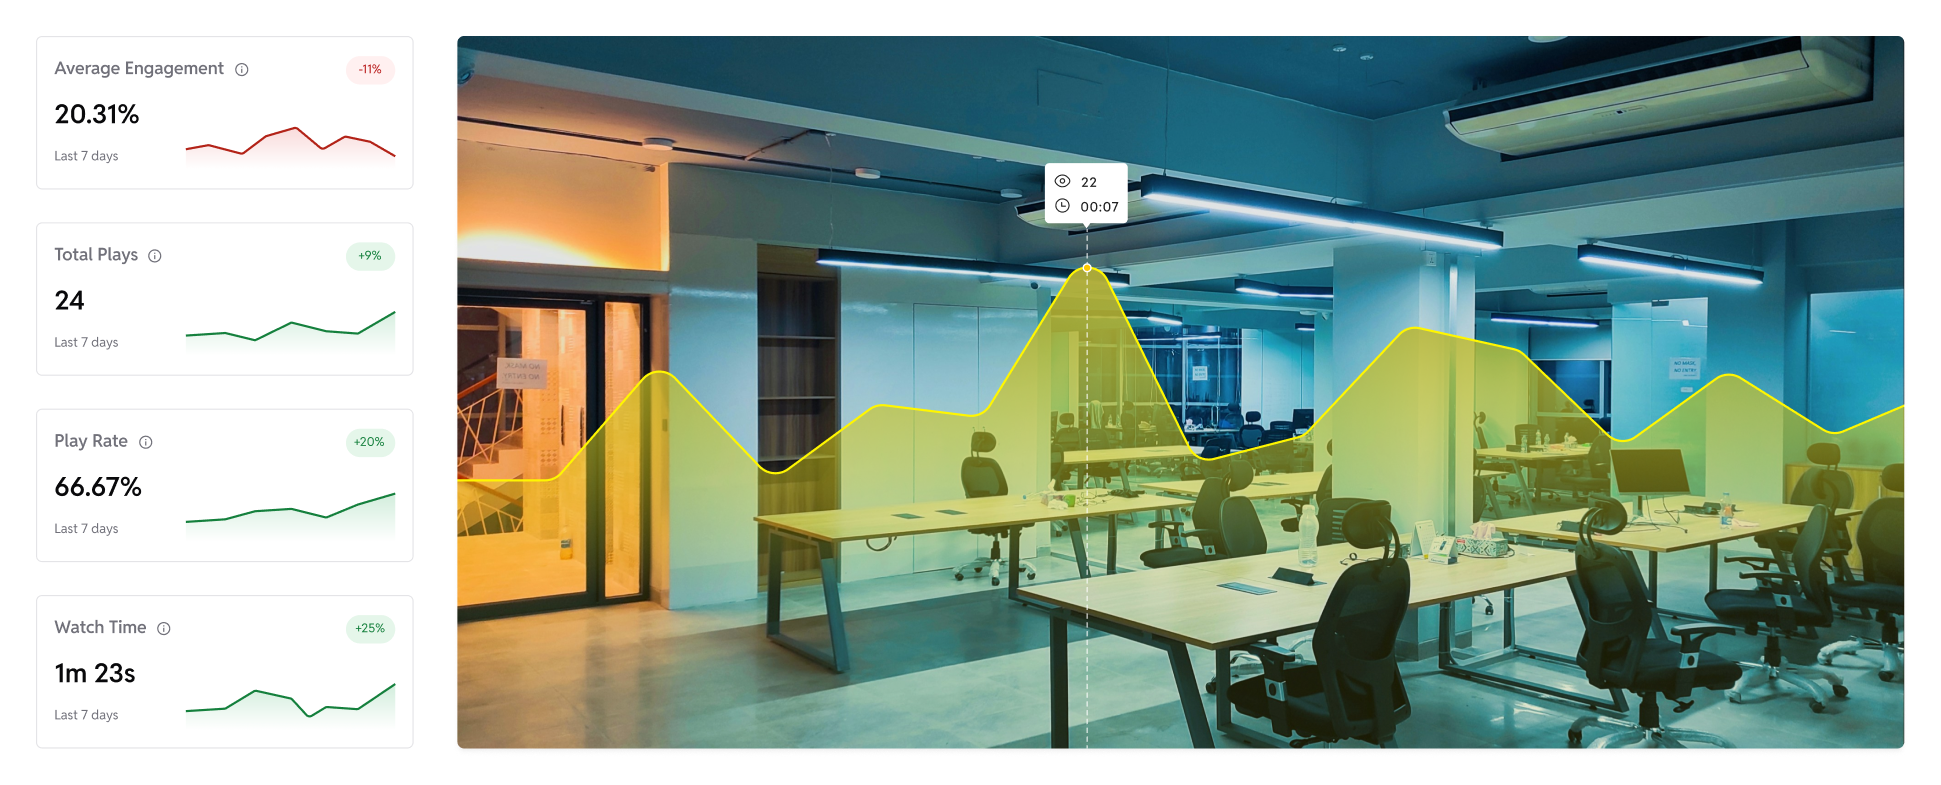
Average Engagement tells you what percentage of the video viewers actually watch on average. It reveals if audiences are staying until the end or dropping off early. Use it to fine-tune pacing, scripts, and storytelling.
Action Step – If engagement is low, tighten scripts, add hooks early, and place the main value within the first 30–60 seconds.
Total Plays
Shows the number of views a specific video has received across all placements. It indicates the popularity and visibility of that video. Use this to assess performance against other videos in your library.
Action Step – If total plays are low, feature the video on more pages, share externally, or test embedding it in higher-traffic posts.
Play Rate
Measures how many people clicked Play after the video loaded. For a single video, it reveals how compelling its thumbnail and placement are. Use it to test different thumbnails or improve video positioning.
Action Step – If play rate is low, refresh the thumbnail, update the title, or experiment with video placement above the fold.
Watch Time
This is the cumulative time viewers spent watching a single video. It’s a strong signal of audience interest and depth of engagement. Use it to assess whether long-form or short-form formats are performing better.
Action Step – If watch time is low, re-edit the video for conciseness or adjust pacing to hold attention longer.
Heatmap
Heatmaps visualize exactly where viewers rewatched, skipped, or dropped off. They provide a second-by-second “engagement fingerprint.” Use this to optimize pacing, tighten intros, and place CTAs where attention peaks.
Action Step – If drop-offs cluster early, rework intros. If peaks occur later, consider moving valuable content earlier or repeating it for emphasis.
Playback Performance
Displays a timeline of Play Rate and Engagement changes for that single video. It lets you see how updates or external events impacted performance. Use it to track improvement after edits or campaign pushes.
Action Step – If metrics decline after changes, revert or test alternatives. If improvements show, double down on similar tactics.
Views by Location
Shows where viewers of a single video are located. It helps you spot geographic strengths or weaknesses for that specific content. Use it to adjust messaging or target ads by region.
Action Step – Create region-specific content, localize or translate videos for high-view regions and make country specific landing pages for countries with the highest traffic with top engaging translated videos to increase conversion.
Views by Post Source
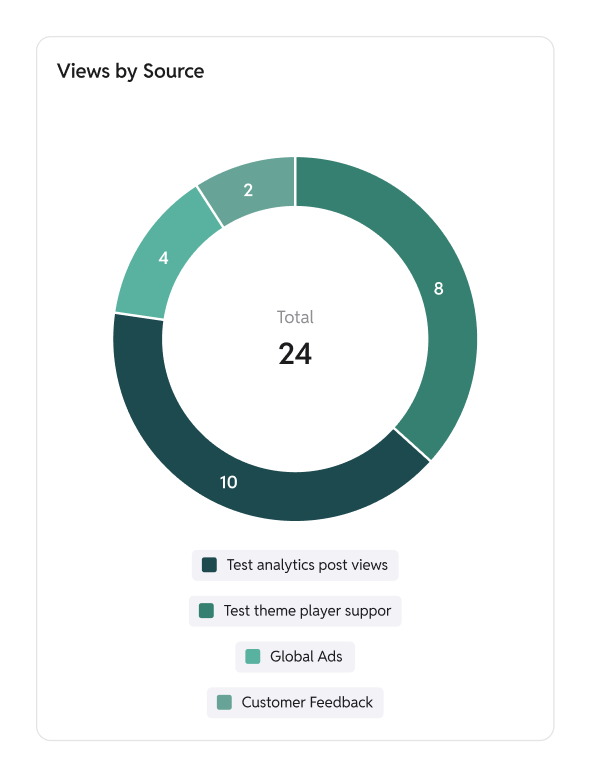
Reveals which blog posts or pages drove the most views for a single video. It shows where your video performs best in context. Use it to strategically embed videos where they deliver maximum engagement.
Action Step – If a video performs poorly on certain posts, move or replace it. Double down on high-performing placements with similar content.
Performance Comparison
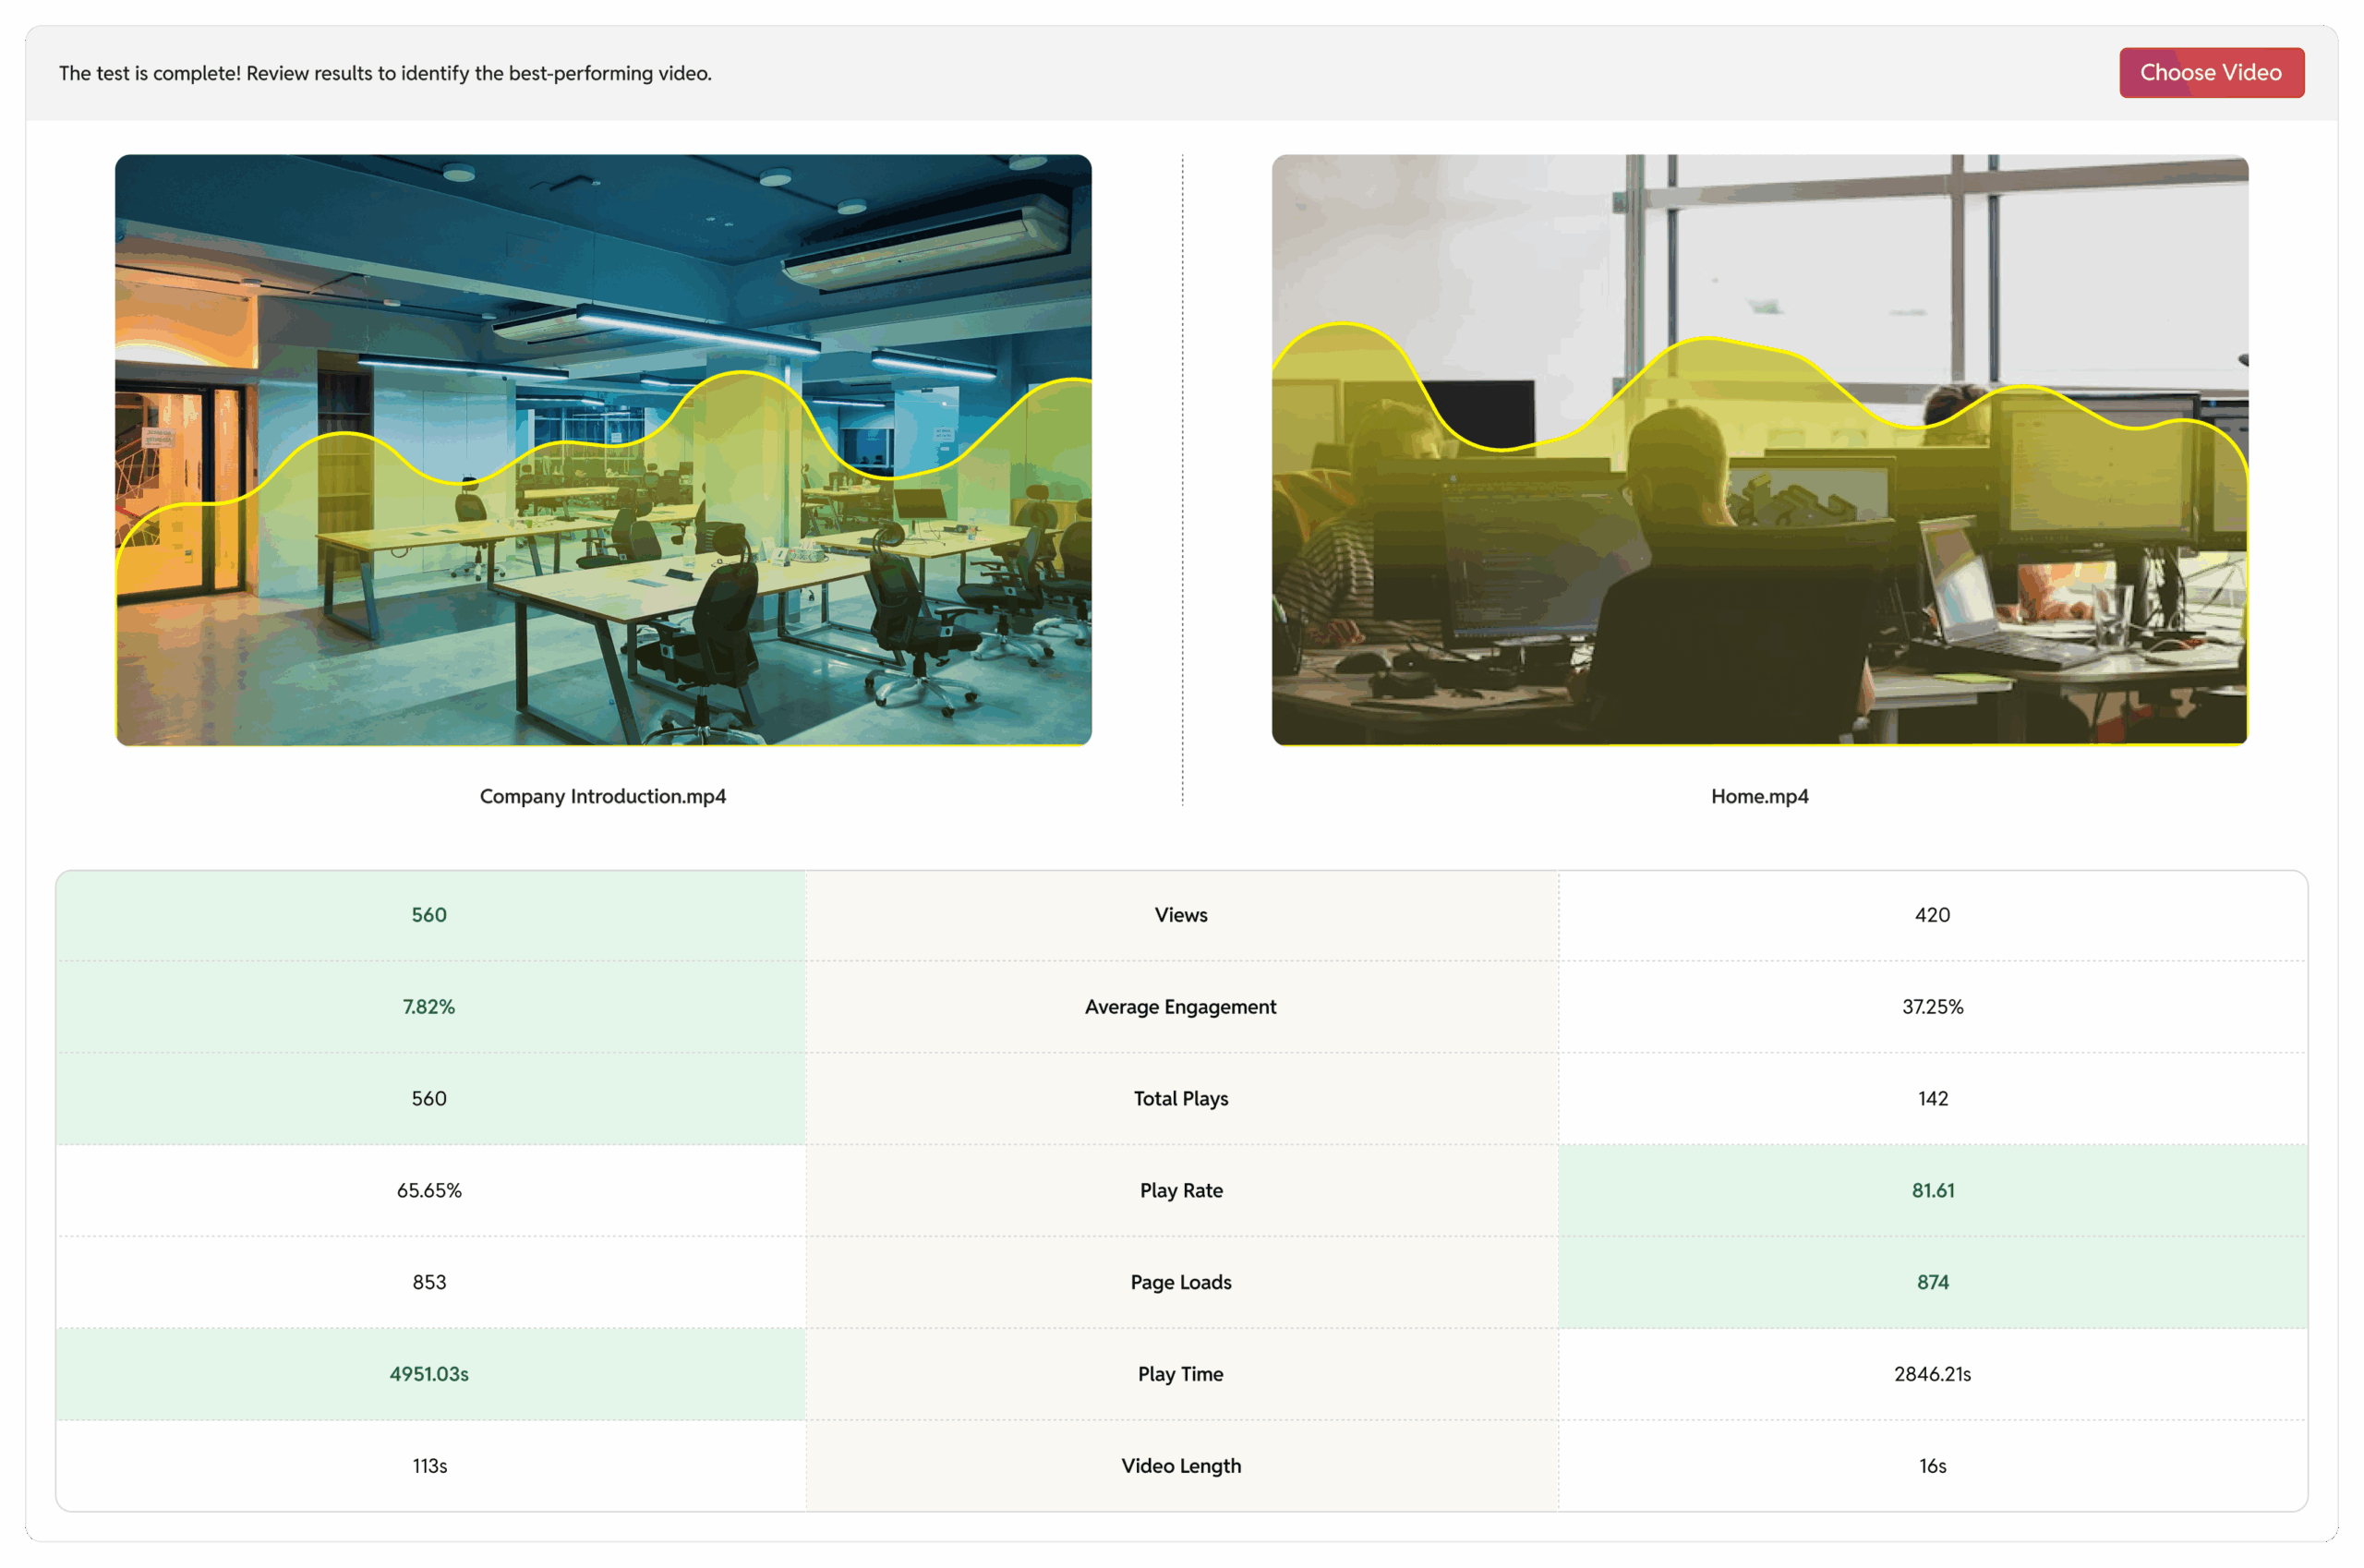
Allows you to compare 2 videos side-by-side on key metrics like views, average engagement, play time and more. Use it to decide what to scale, repurpose, or retire.
Action Step – Use top-performing video formats as templates, and rework or replace underperformers. Compare old vs new to decide what to update.
Watch our video
Final Thoughts
Video is one of the most powerful tools for building authority and driving conversions on WordPress, but only if you know how to use it. With GoDAM’s analytics dashboard, you can move beyond vanity metrics and make data-driven content decisions that grow your business.
Ready to try GoDAM analytics? Try 7-day Free Trial.
On this page

